
- Start >
- Rivers >
- Discharge >
- Obere Donau >
- Unterbergen >
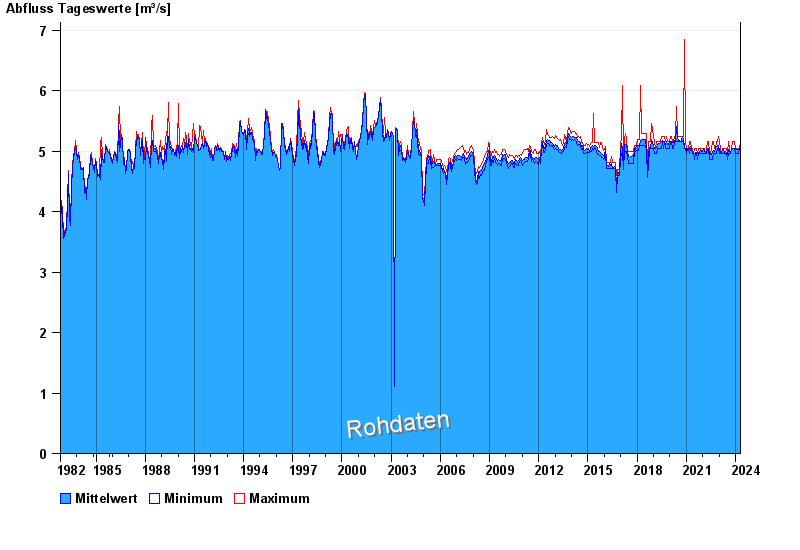
- Chart of total period

Chart of total period Unterbergen / Lochbach
Discharge from 01.11.1982 to 23.04.2024
| Date | Mean value [m³/s] | Maximum [m³/s] | Minimum [m³/s] |
|---|---|---|---|
| 23.04.2024 | 4.98 | 5.05 | 4.96 |
| 22.04.2024 | 5.01 | 5.05 | 4.96 |
| 21.04.2024 | 5.02 | 5.05 | 4.96 |
| 20.04.2024 | 5 | 5.05 | 4.96 |
| 19.04.2024 | 4.98 | 5.05 | 4.96 |
| 18.04.2024 | 5.02 | 5.05 | 4.96 |
| 17.04.2024 | 5.02 | 5.05 | 4.96 |
© Bayerisches Landesamt für Umwelt 2024