
- Start >
- Rivers >
- Discharge >
- Obere Donau >
- Treuchtlingen >
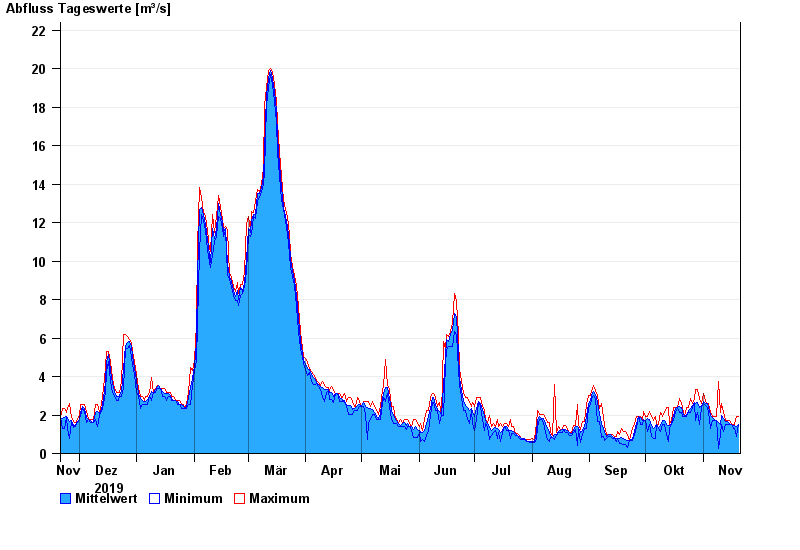
- Chart of year

Chart of year Treuchtlingen / Altmühl
Discharge from 21.11.2019 to 20.11.2020
| Date | Mean value [m³/s] | Maximum [m³/s] | Minimum [m³/s] |
|---|---|---|---|
| 20.11.2020 | 1.5 | 1.91 | 1.49 |
| 19.11.2020 | 1.4 | 1.91 | 0.868 |
| 18.11.2020 | 1.47 | 1.49 | 1.31 |
| 17.11.2020 | 1.48 | 1.49 | 1.31 |
| 16.11.2020 | 1.49 | 1.49 | 1.49 |
| 15.11.2020 | 1.56 | 1.69 | 1.49 |
| 14.11.2020 | 1.65 | 1.69 | 1.49 |
© Bayerisches Landesamt für Umwelt 2024