
- Start >
- Rivers >
- Discharge >
- Obere Donau >
- Treuchtlingen >
- Chart of year

Chart of year Treuchtlingen / Altmühl
Discharge from 21.11.2018 to 20.11.2019
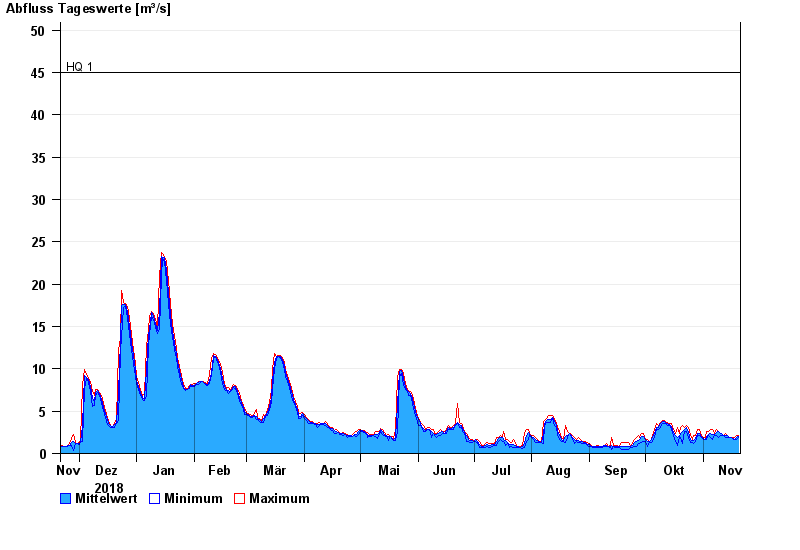
- HQ1 45 m³/s
- HQ2 63 m³/s
- HQ5 85 m³/s
- HQ10 110 m³/s
- HQ20 135 m³/s
- HQ50 170 m³/s
- HQ100 200 m³/s
| Date | Mean value [m³/s] | Maximum [m³/s] | Minimum [m³/s] |
|---|---|---|---|
| 20.11.2019 | 1.95 | 2.11 | 1.89 |
| 19.11.2019 | 1.86 | 2.11 | 1.67 |
| 18.11.2019 | 1.68 | 1.89 | 1.67 |
| 17.11.2019 | 1.74 | 1.89 | 1.67 |
| 16.11.2019 | 1.89 | 1.89 | 1.89 |
| 15.11.2019 | 1.89 | 1.89 | 1.89 |
| 14.11.2019 | 2.07 | 2.11 | 1.89 |
© Bayerisches Landesamt für Umwelt 2024