
- Start >
- Rivers >
- Discharge >
- Obere Donau >
- Treuchtlingen >
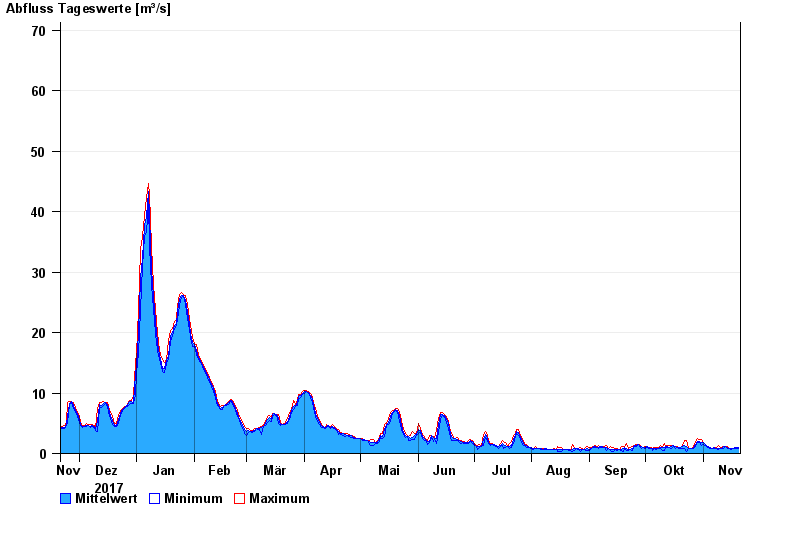
- Chart of year

Chart of year Treuchtlingen / Altmühl
Discharge from 21.11.2017 to 20.11.2018
- 05.03.1956 Abfluss: 183 m³/s
- 21.03.1942 Abfluss: 168 m³/s
- 18.03.1988 Abfluss: 158 m³/s
- 24.02.1970 Abfluss: 145 m³/s
- 07.02.1945 Abfluss: 129 m³/s
| Date | Mean value [m³/s] | Maximum [m³/s] | Minimum [m³/s] |
|---|---|---|---|
| 20.11.2018 | 0.965 | 0.974 | 0.762 |
| 19.11.2018 | 0.976 | 1.05 | 0.905 |
| 18.11.2018 | 0.933 | 1.05 | 0.905 |
| 17.11.2018 | 0.848 | 0.905 | 0.791 |
| 16.11.2018 | 0.824 | 0.905 | 0.699 |
| 15.11.2018 | 0.805 | 0.844 | 0.791 |
| 14.11.2018 | 0.975 | 1.12 | 0.812 |
© Bayerisches Landesamt für Umwelt 2024