
- Start >
- Rivers >
- Discharge >
- Obere Donau >
- Treuchtlingen >
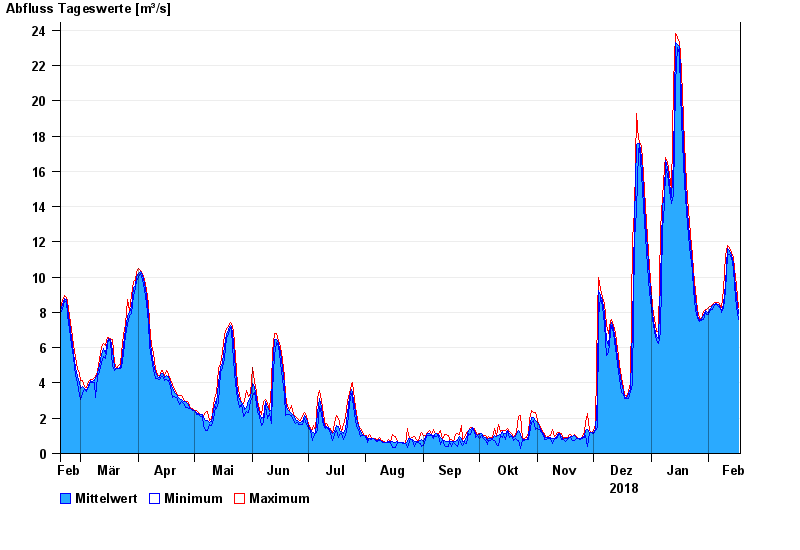
- Chart of year

Chart of year Treuchtlingen / Altmühl
Discharge from 18.02.2018 to 17.02.2019
| Date | Mean value [m³/s] | Maximum [m³/s] | Minimum [m³/s] |
|---|---|---|---|
| 17.02.2019 | 7.91 | 8.27 | 7.61 |
| 16.02.2019 | 8.84 | 9.51 | 8.26 |
| 15.02.2019 | 10 | 10.5 | 9.51 |
| 14.02.2019 | 10.8 | 11.1 | 10.5 |
| 13.02.2019 | 11.2 | 11.4 | 11.1 |
| 12.02.2019 | 11.5 | 11.7 | 11.3 |
| 11.02.2019 | 11.6 | 11.8 | 11.2 |
© Bayerisches Landesamt für Umwelt 2024