
- Start >
- Rivers >
- Discharge >
- Obere Donau >
- Treuchtlingen >
- Chart of year

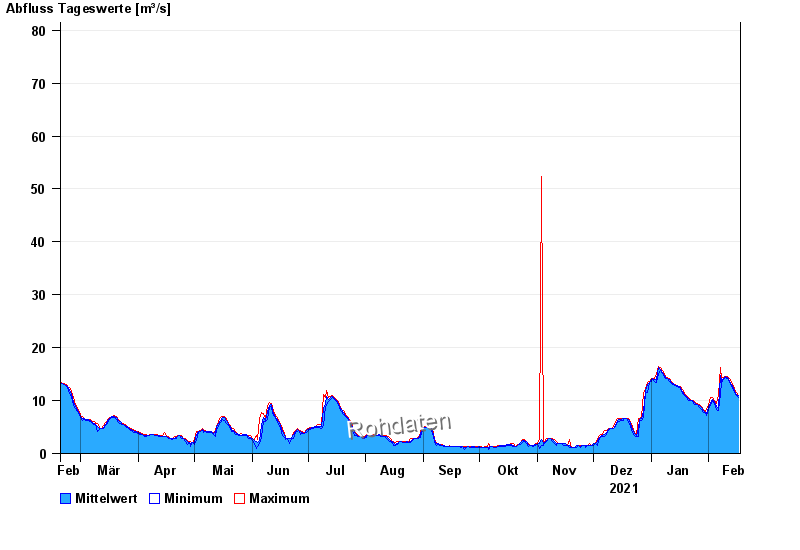
Chart of year Treuchtlingen / Altmühl
Discharge from 18.02.2021 to 17.02.2022
- 05.03.1956 Abfluss: 183 m³/s
- 21.03.1942 Abfluss: 168 m³/s
- 18.03.1988 Abfluss: 158 m³/s
- 24.02.1970 Abfluss: 145 m³/s
- 07.02.1945 Abfluss: 129 m³/s
| Date | Mean value [m³/s] | Maximum [m³/s] | Minimum [m³/s] |
|---|---|---|---|
| 17.02.2022 | 10.9 | 11 | 10.6 |
| 16.02.2022 | 11.1 | 11.5 | 10.9 |
| 15.02.2022 | 11.8 | 12.1 | 11.6 |
| 14.02.2022 | 12.5 | 12.8 | 12.1 |
| 13.02.2022 | 13 | 13.4 | 12.7 |
| 12.02.2022 | 13.7 | 14.1 | 13.4 |
| 11.02.2022 | 14.4 | 14.5 | 14.1 |
© Bayerisches Landesamt für Umwelt 2024