
- Start >
- Rivers >
- Discharge >
- Obere Donau >
- Treuchtlingen >
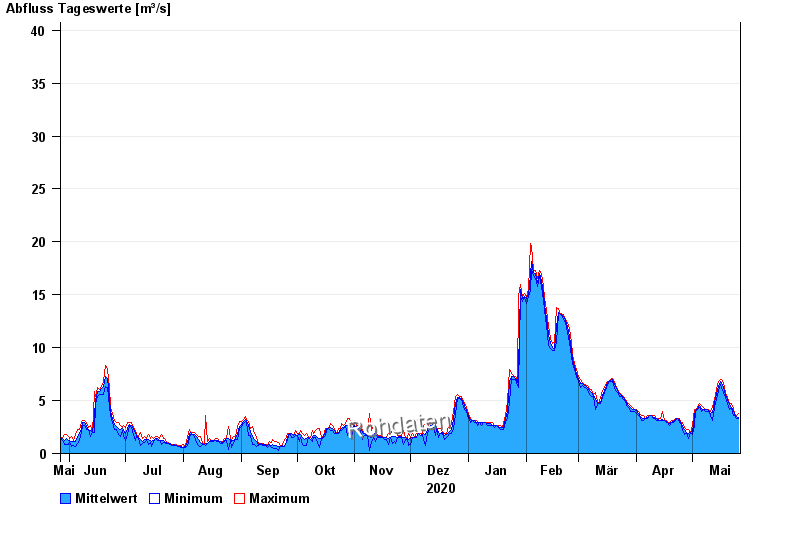
- Chart of year

Chart of year Treuchtlingen / Altmühl
Discharge from 27.05.2020 to 26.05.2021
- HQ1 45 m³/s
- HQ2 63 m³/s
- HQ5 85 m³/s
- HQ10 110 m³/s
- HQ20 135 m³/s
- HQ50 170 m³/s
- HQ100 200 m³/s
| Date | Mean value [m³/s] | Maximum [m³/s] | Minimum [m³/s] |
|---|---|---|---|
| 26.05.2021 | 3.41 | 3.79 | 3.33 |
| 25.05.2021 | 3.54 | 3.57 | 3.33 |
| 24.05.2021 | 3.73 | 3.79 | 3.57 |
| 23.05.2021 | 4.04 | 4.21 | 3.57 |
| 22.05.2021 | 4.37 | 4.77 | 4.21 |
| 21.05.2021 | 4.6 | 4.72 | 4.17 |
| 20.05.2021 | 5.07 | 5.26 | 4.72 |
© Bayerisches Landesamt für Umwelt 2024