
- Start >
- Rivers >
- Discharge >
- Obere Donau >
- Thann >
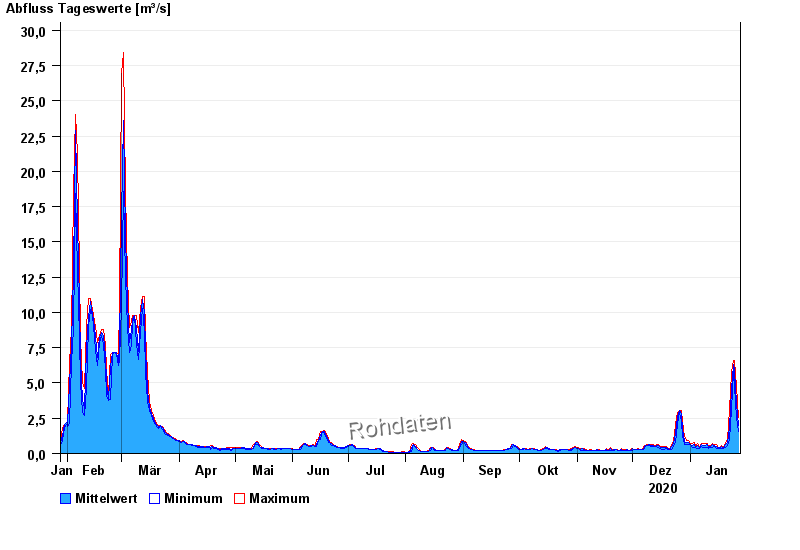
- Chart of year

Chart of year Thann / Altmühl
Discharge from 28.01.2020 to 27.01.2021
| Date | Mean value [m³/s] | Maximum [m³/s] | Minimum [m³/s] |
|---|---|---|---|
| 27.01.2021 | 1.97 | 2.55 | 1.56 |
| 26.01.2021 | 3.53 | 4.72 | 2.55 |
| 25.01.2021 | 5.85 | 6.56 | 4.72 |
| 24.01.2021 | 6.32 | 6.56 | 5.8 |
| 23.01.2021 | 4.51 | 5.74 | 3.13 |
| 22.01.2021 | 1.83 | 3.09 | 0.999 |
| 21.01.2021 | 0.79 | 0.999 | 0.566 |
© Bayerisches Landesamt für Umwelt 2024