
- Start >
- Rivers >
- Discharge >
- Obere Donau >
- Thann >
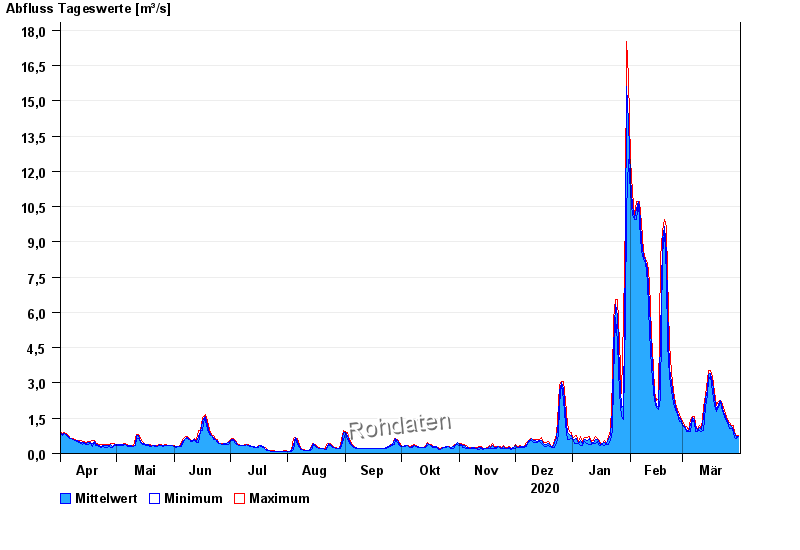
- Chart of year

Chart of year Thann / Altmühl
Discharge from 01.04.2020 to 31.03.2021
| Date | Mean value [m³/s] | Maximum [m³/s] | Minimum [m³/s] |
|---|---|---|---|
| 31.03.2021 | 0.741 | 0.752 | 0.731 |
| 30.03.2021 | 0.674 | 0.731 | 0.644 |
| 29.03.2021 | 0.837 | 0.896 | 0.687 |
| 28.03.2021 | 0.991 | 1.17 | 0.896 |
| 27.03.2021 | 1.14 | 1.17 | 1.08 |
| 26.03.2021 | 1.23 | 1.32 | 1.08 |
| 25.03.2021 | 1.38 | 1.45 | 1.32 |
© Bayerisches Landesamt für Umwelt 2024