
- Start >
- Rivers >
- Discharge >
- Obere Donau >
- Thann >
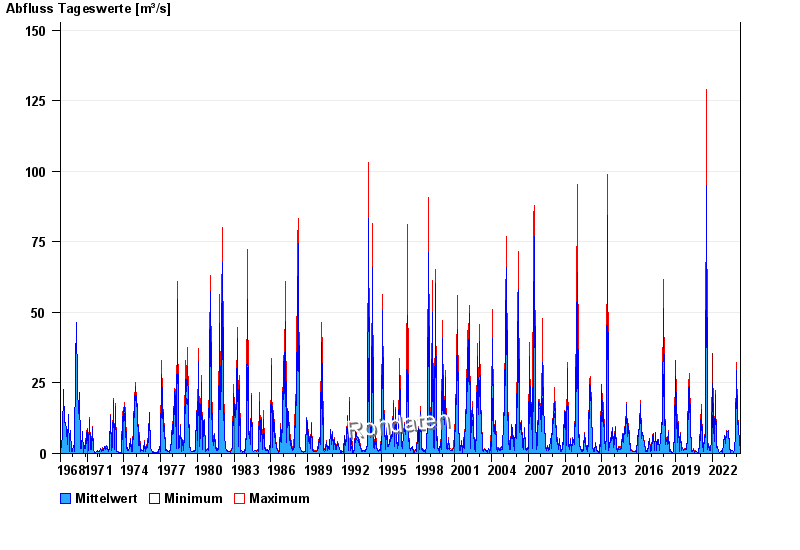
- Chart of total period

Chart of total period Thann / Altmühl
Discharge from 01.11.1968 to 19.04.2024
| Date | Mean value [m³/s] | Maximum [m³/s] | Minimum [m³/s] |
|---|---|---|---|
| 19.04.2024 | 1.39 | 1.48 | 1.31 |
| 18.04.2024 | 1.58 | 1.62 | 1.48 |
| 17.04.2024 | 1.53 | 1.62 | 1.37 |
| 16.04.2024 | 1.21 | 1.37 | 1 |
| 15.04.2024 | 0.954 | 1 | 0.863 |
| 14.04.2024 | 0.863 | 0.863 | 0.863 |
| 13.04.2024 | 0.891 | 1 | 0.863 |
© Bayerisches Landesamt für Umwelt 2024