
- Start >
- Rivers >
- Discharge >
- Obere Donau >
- Seemannsmühle >
- Chart of total period

Chart of total period Seemannsmühle / Schwäbische Rezat
Discharge from 01.11.1969 to 25.04.2024
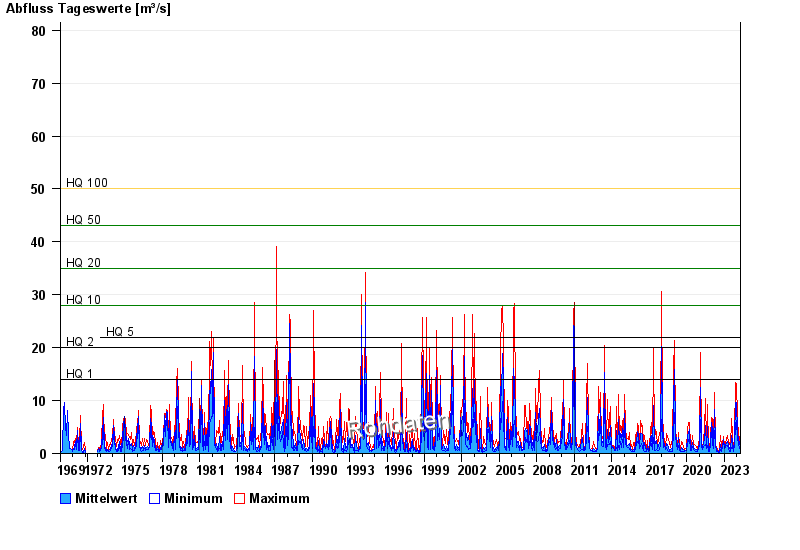
- HQ1 14 m³/s
- HQ2 20 m³/s
- HQ5 22 m³/s
- HQ10 28 m³/s
- HQ20 35 m³/s
- HQ50 43 m³/s
- HQ100 50 m³/s
| Date | Mean value [m³/s] | Maximum [m³/s] | Minimum [m³/s] |
|---|---|---|---|
| 25.04.2024 | 0.513 | 0.53 | 0.503 |
| 24.04.2024 | 0.531 | 0.595 | 0.503 |
| 23.04.2024 | 0.564 | 0.628 | 0.53 |
| 22.04.2024 | 0.66 | 0.887 | 0.444 |
| 21.04.2024 | 0.708 | 0.926 | 0.416 |
| 20.04.2024 | 0.748 | 1.14 | 0.563 |
| 19.04.2024 | 0.526 | 0.697 | 0.503 |
© Bayerisches Landesamt für Umwelt 2024