
- Start >
- Rivers >
- Discharge >
- Obere Donau >
- Schwabach >
- Chart of total period

Chart of total period Schwabach / Schwabach
Discharge from 01.11.1964 to 17.04.2024
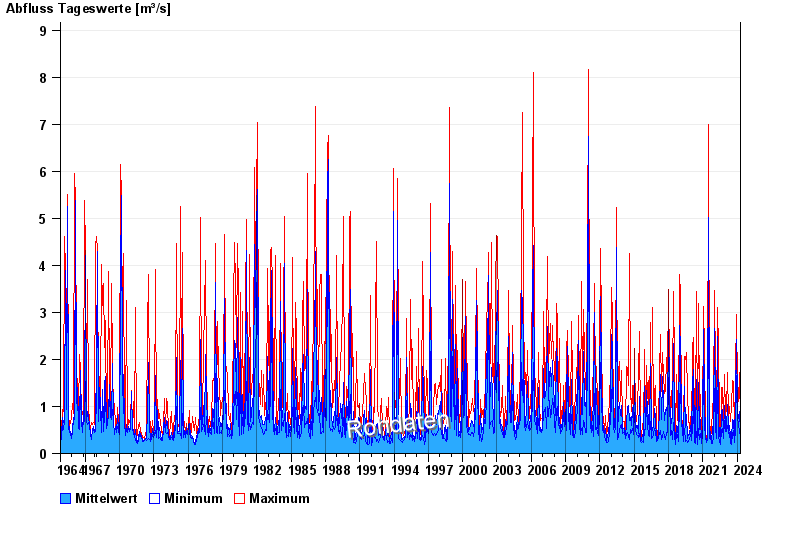
| Date | Mean value [m³/s] | Maximum [m³/s] | Minimum [m³/s] |
|---|---|---|---|
| 17.04.2024 | 0.458 | 0.565 | 0.363 |
| 16.04.2024 | 0.347 | 0.44 | 0.279 |
| 15.04.2024 | 0.315 | 0.363 | 0.279 |
| 14.04.2024 | 0.276 | 0.298 | 0.261 |
| 13.04.2024 | 0.288 | 0.319 | 0.279 |
| 12.04.2024 | 0.279 | 0.298 | 0.261 |
| 11.04.2024 | 0.244 | 0.279 | 0.213 |
© Bayerisches Landesamt für Umwelt 2024