
- Start >
- Rivers >
- Discharge >
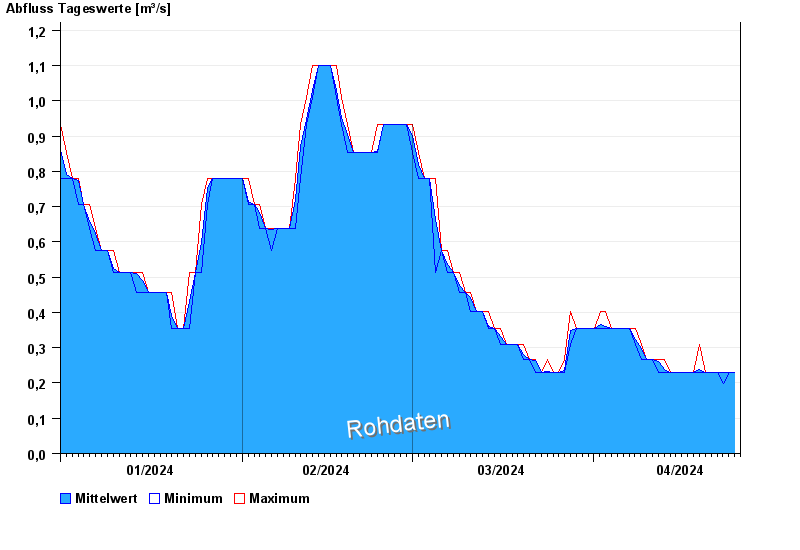
- Obere Donau >
- Schambach >
- Chart of year

Chart of year Schambach / Schambach
Discharge from 01.01.2024 to 25.04.2024
- 14.01.2011 Abfluss: 8,44 m³/s
- 15.04.1994 Abfluss: 8,34 m³/s
- 12.06.1965 Abfluss: 7,63 m³/s
- 04.03.1987 Abfluss: 6,99 m³/s
- 26.03.1988 Abfluss: 6,75 m³/s
| Date | Mean value [m³/s] | Maximum [m³/s] | Minimum [m³/s] |
|---|---|---|---|
| 25.04.2024 | 0.231 | 0.231 | 0.231 |
| 24.04.2024 | 0.231 | 0.231 | 0.231 |
| 23.04.2024 | 0.231 | 0.231 | 0.198 |
| 22.04.2024 | 0.231 | 0.231 | 0.231 |
| 21.04.2024 | 0.231 | 0.231 | 0.231 |
| 20.04.2024 | 0.231 | 0.231 | 0.231 |
| 19.04.2024 | 0.239 | 0.308 | 0.231 |
© Bayerisches Landesamt für Umwelt 2024