
- Start >
- Rivers >
- Discharge >
- Obere Donau >
- Schambach >
- Chart of total period

Chart of total period Schambach / Schambach
Discharge from 01.11.1963 to 20.04.2024
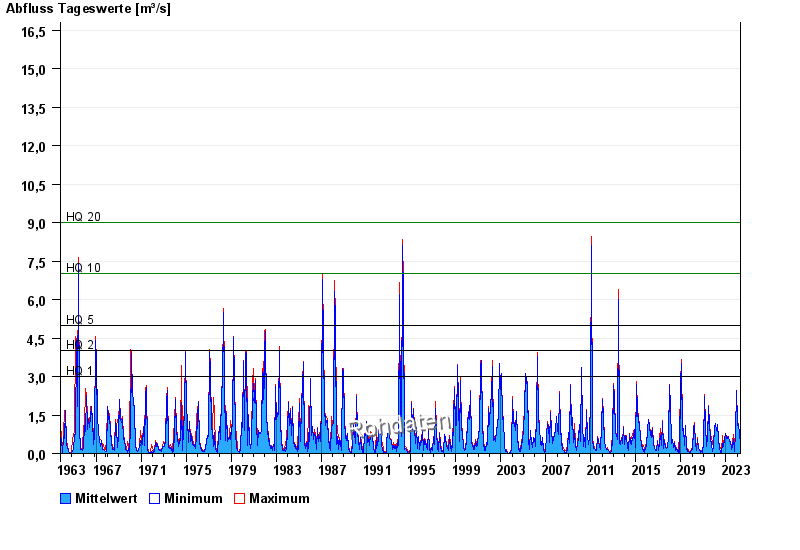
- HQ1 3 m³/s
- HQ2 4 m³/s
- HQ5 5 m³/s
- HQ10 7 m³/s
- HQ20 9 m³/s
| Date | Mean value [m³/s] | Maximum [m³/s] | Minimum [m³/s] |
|---|---|---|---|
| 20.04.2024 | 0.231 | 0.231 | 0.231 |
| 19.04.2024 | 0.239 | 0.308 | 0.231 |
| 18.04.2024 | 0.231 | 0.231 | 0.231 |
| 17.04.2024 | 0.231 | 0.231 | 0.231 |
| 16.04.2024 | 0.231 | 0.231 | 0.231 |
| 15.04.2024 | 0.231 | 0.231 | 0.231 |
| 14.04.2024 | 0.231 | 0.231 | 0.231 |
© Bayerisches Landesamt für Umwelt 2024