
- Start >
- Rivers >
- Discharge >
- Obere Donau >
- Roth Kläranlage >
- Chart of total period

Chart of total period Roth Kläranlage / Rednitz
Discharge from 01.11.1966 to 18.04.2024
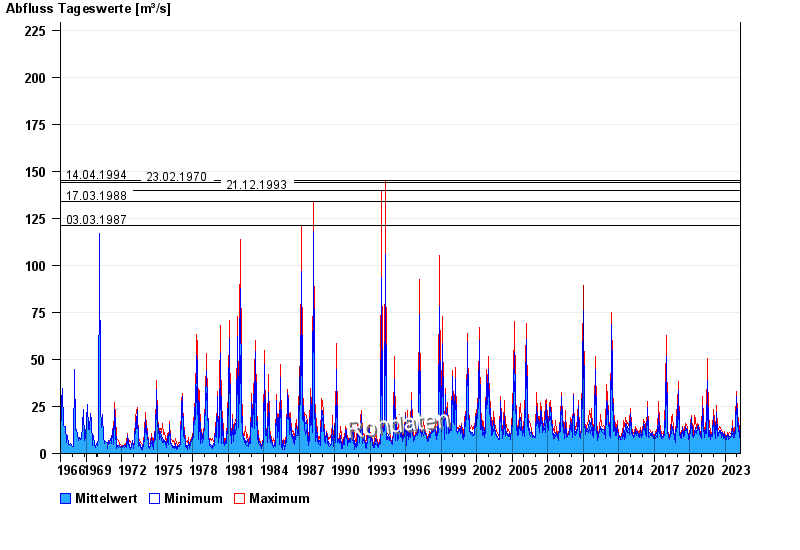
- 14.04.1994 Abfluss: 145 m³/s
- 23.02.1970 Abfluss: 144 m³/s
- 21.12.1993 Abfluss: 140 m³/s
- 17.03.1988 Abfluss: 134 m³/s
- 03.03.1987 Abfluss: 121 m³/s
| Date | Mean value [m³/s] | Maximum [m³/s] | Minimum [m³/s] |
|---|---|---|---|
| 18.04.2024 | 5.48 | 5.63 | 5.2 |
| 17.04.2024 | 5.48 | 5.93 | 4.91 |
| 16.04.2024 | 4.77 | 5.2 | 4.35 |
| 15.04.2024 | 6.44 | 7.46 | 4.77 |
| 14.04.2024 | 6.7 | 7 | 6.53 |
| 13.04.2024 | 6.81 | 7.15 | 6.53 |
| 12.04.2024 | 5.7 | 7.15 | 4.08 |
© Bayerisches Landesamt für Umwelt 2024