
- Start >
- Rivers >
- Discharge >
- Obere Donau >
- Roth Bleiche >
- Chart of total period

Chart of total period Roth Bleiche / Roth
Discharge from 01.11.1968 to 20.04.2024
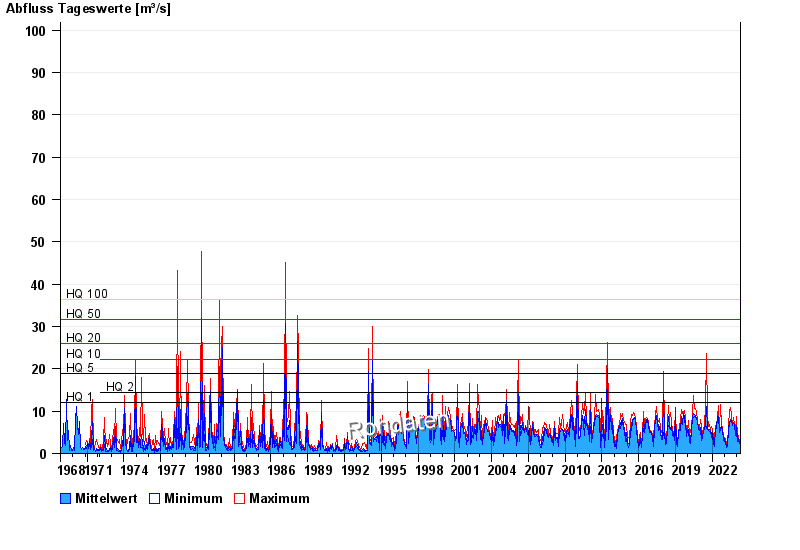
- HQ1 12 m³/s
- HQ2 14,5 m³/s
- HQ5 18,8 m³/s
- HQ10 22,3 m³/s
- HQ20 26 m³/s
- HQ50 31,7 m³/s
- HQ100 36,4 m³/s
| Date | Mean value [m³/s] | Maximum [m³/s] | Minimum [m³/s] |
|---|---|---|---|
| 20.04.2024 | 1.44 | 1.56 | 1.19 |
| 19.04.2024 | 1.25 | 1.72 | 1.13 |
| 18.04.2024 | 1.18 | 1.26 | 1.07 |
| 17.04.2024 | 1.29 | 1.4 | 1.19 |
| 16.04.2024 | 1.22 | 1.56 | 1.13 |
| 15.04.2024 | 2.98 | 3.88 | 1.26 |
| 14.04.2024 | 3.59 | 3.59 | 3.17 |
© Bayerisches Landesamt für Umwelt 2024