
- Start >
- Rivers >
- Discharge >
- Obere Donau >
- Roth >
- Chart of year

Chart of year Roth / Roth
Discharge from 22.02.2022 to 21.02.2023
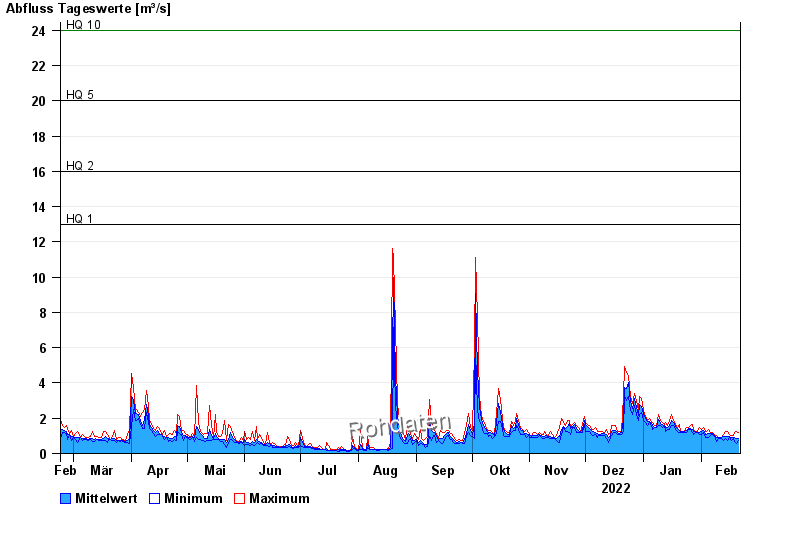
- HQ1 13 m³/s
- HQ2 16 m³/s
- HQ5 20 m³/s
- HQ10 24 m³/s
- HQ20 28 m³/s
- HQ50 34 m³/s
- HQ100 38 m³/s
| Date | Mean value [m³/s] | Maximum [m³/s] | Minimum [m³/s] |
|---|---|---|---|
| 21.02.2023 | 0.846 | 1.18 | 0.76 |
| 20.02.2023 | 0.867 | 1.27 | 0.552 |
| 19.02.2023 | 0.893 | 1.18 | 0.686 |
| 18.02.2023 | 0.914 | 0.998 | 0.837 |
| 17.02.2023 | 0.892 | 0.998 | 0.76 |
| 16.02.2023 | 0.992 | 1.09 | 0.916 |
| 15.02.2023 | 0.969 | 1.27 | 0.76 |
© Bayerisches Landesamt für Umwelt 2024