
- Start >
- Rivers >
- Discharge >
- Obere Donau >
- Roth >
- Chart of year

Chart of year Roth / Roth
Discharge from 01.11.2020 to 31.10.2021
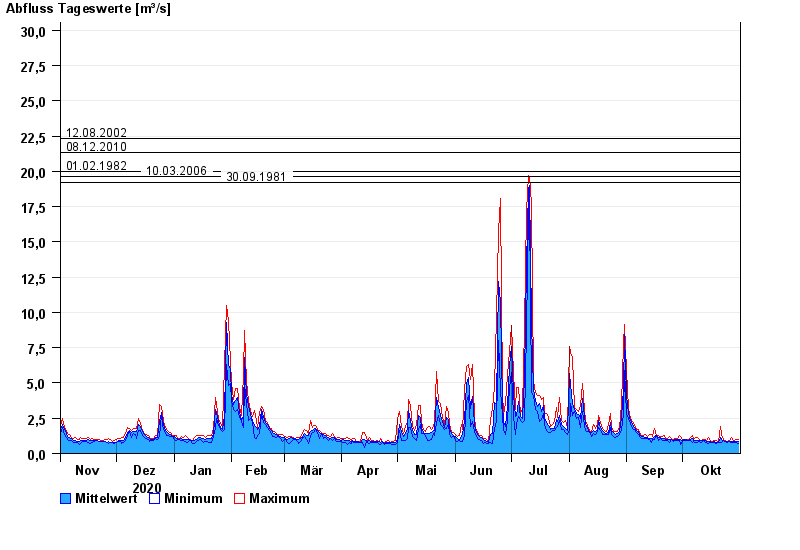
- 12.08.2002 Abfluss: 22,3 m³/s
- 08.12.2010 Abfluss: 21,3 m³/s
- 01.02.1982 Abfluss: 20 m³/s
- 10.03.2006 Abfluss: 19,6 m³/s
- 30.09.1981 Abfluss: 19,2 m³/s
| Date | Mean value [m³/s] | Maximum [m³/s] | Minimum [m³/s] |
|---|---|---|---|
| 31.10.2021 | 0.859 | 1.02 | 0.715 |
| 30.10.2021 | 0.85 | 1.02 | 0.786 |
| 29.10.2021 | 0.858 | 0.939 | 0.785 |
| 28.10.2021 | 0.849 | 0.938 | 0.785 |
| 27.10.2021 | 0.837 | 1.11 | 0.785 |
| 26.10.2021 | 0.879 | 0.938 | 0.859 |
| 25.10.2021 | 0.856 | 0.859 | 0.784 |
© Bayerisches Landesamt für Umwelt 2024