
- Start >
- Rivers >
- Discharge >
- Obere Donau >
- Roth >
- Chart of year

Chart of year Roth / Roth
Discharge from 06.04.2020 to 05.04.2021
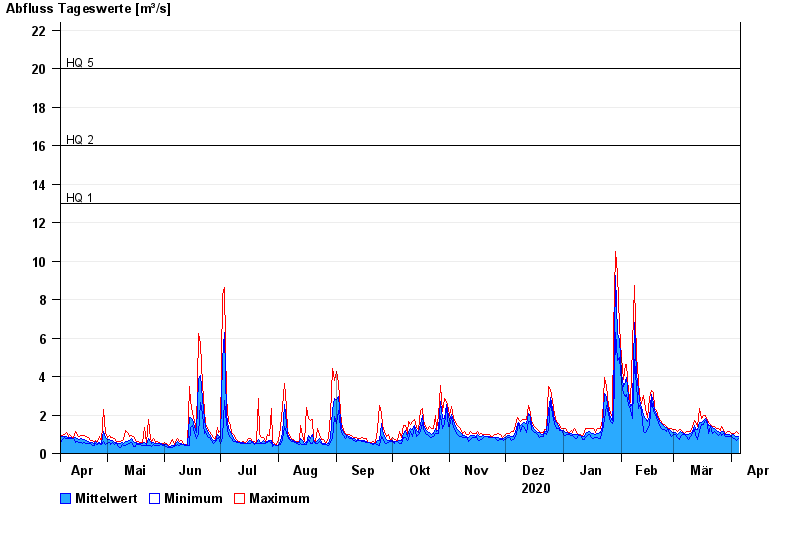
- HQ1 13 m³/s
- HQ2 16 m³/s
- HQ5 20 m³/s
- HQ10 24 m³/s
- HQ20 28 m³/s
- HQ50 34 m³/s
- HQ100 38 m³/s
| Date | Mean value [m³/s] | Maximum [m³/s] | Minimum [m³/s] |
|---|---|---|---|
| 05.04.2021 | 0.901 | 1.04 | 0.795 |
| 04.04.2021 | 0.891 | 1.12 | 0.654 |
| 03.04.2021 | 0.926 | 1.04 | 0.795 |
| 02.04.2021 | 0.98 | 1.04 | 0.796 |
| 01.04.2021 | 0.93 | 1.04 | 0.872 |
| 31.03.2021 | 0.967 | 1.13 | 0.873 |
| 30.03.2021 | 0.971 | 1.13 | 0.873 |
© Bayerisches Landesamt für Umwelt 2024