
- Start >
- Rivers >
- Discharge >
- Obere Donau >
- Roth >
- Chart of total period

Chart of total period Roth / Roth
Discharge from 01.11.1978 to 16.04.2024
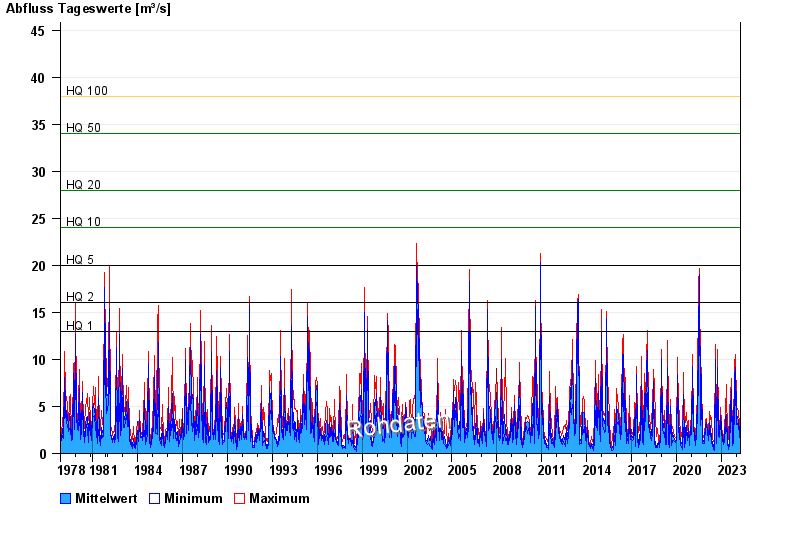
- HQ1 13 m³/s
- HQ2 16 m³/s
- HQ5 20 m³/s
- HQ10 24 m³/s
- HQ20 28 m³/s
- HQ50 34 m³/s
- HQ100 38 m³/s
| Date | Mean value [m³/s] | Maximum [m³/s] | Minimum [m³/s] |
|---|---|---|---|
| 16.04.2024 | 1.16 | 1.16 | 1.07 |
| 15.04.2024 | 0.97 | 1.35 | 0.751 |
| 14.04.2024 | 0.828 | 0.828 | 0.828 |
| 13.04.2024 | 0.853 | 0.908 | 0.751 |
| 12.04.2024 | 0.913 | 0.99 | 0.828 |
| 11.04.2024 | 0.981 | 0.99 | 0.908 |
| 10.04.2024 | 1.01 | 1.07 | 0.99 |
© Bayerisches Landesamt für Umwelt 2024