
- Start >
- Rivers >
- Discharge >
- Obere Donau >
- Reichenbach >
- Chart of year

Chart of year Reichenbach / Wörnitz
Discharge from 01.01.2020 to 31.12.2020
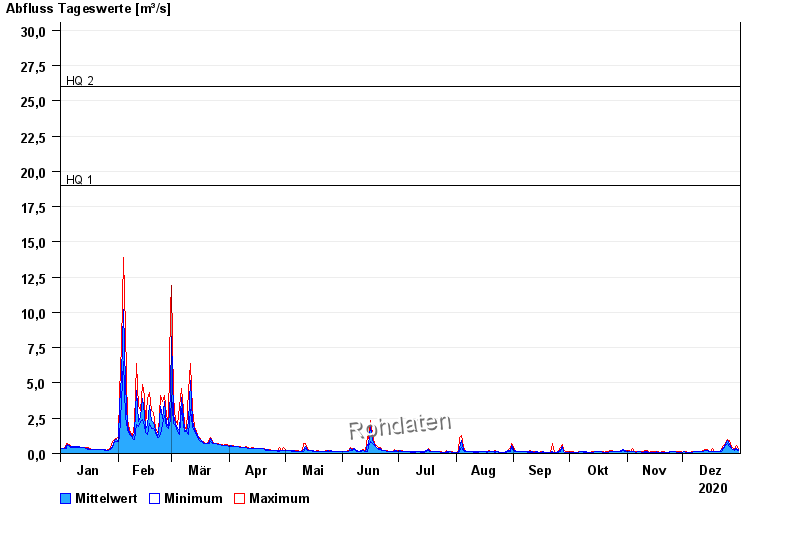
- HQ1 19 m³/s
- HQ2 26 m³/s
- HQ5 36 m³/s
- HQ10 43 m³/s
- HQ20 50 m³/s
- HQ50 60 m³/s
- HQ100 68 m³/s
| Date | Mean value [m³/s] | Maximum [m³/s] | Minimum [m³/s] |
|---|---|---|---|
| 31.12.2020 | 0.262 | 0.326 | 0.246 |
| 30.12.2020 | 0.342 | 0.568 | 0.284 |
| 29.12.2020 | 0.285 | 0.326 | 0.246 |
| 28.12.2020 | 0.29 | 0.326 | 0.284 |
| 27.12.2020 | 0.369 | 0.464 | 0.326 |
| 26.12.2020 | 0.65 | 0.935 | 0.464 |
| 25.12.2020 | 0.89 | 1 | 0.68 |
© Bayerisches Landesamt für Umwelt 2024