
- Start >
- Rivers >
- Discharge >
- Obere Donau >
- Reichenbach >
- Chart of year

Chart of year Reichenbach / Wörnitz
Discharge from 30.01.2023 to 29.01.2024
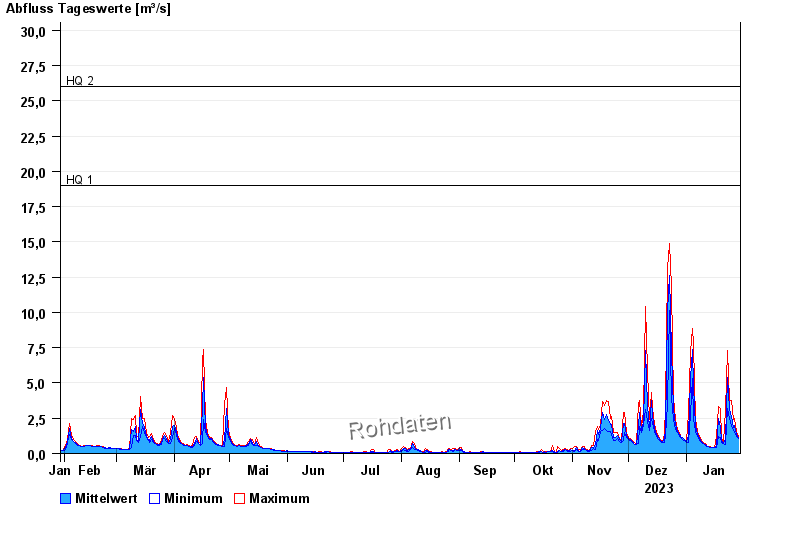
- HQ1 19 m³/s
- HQ2 26 m³/s
- HQ5 36 m³/s
- HQ10 43 m³/s
- HQ20 50 m³/s
- HQ50 60 m³/s
- HQ100 68 m³/s
| Date | Mean value [m³/s] | Maximum [m³/s] | Minimum [m³/s] |
|---|---|---|---|
| 29.01.2024 | 1.13 | 1.23 | 1.09 |
| 28.01.2024 | 1.33 | 1.54 | 1.23 |
| 27.01.2024 | 1.97 | 2.51 | 1.54 |
| 26.01.2024 | 1.82 | 2.42 | 1.63 |
| 25.01.2024 | 2.59 | 3.76 | 1.88 |
| 24.01.2024 | 3.13 | 3.76 | 2.51 |
| 23.01.2024 | 5.42 | 7.32 | 3.21 |
© Bayerisches Landesamt für Umwelt 2024