
- Start >
- Rivers >
- Discharge >
- Obere Donau >
- Pöttmes >
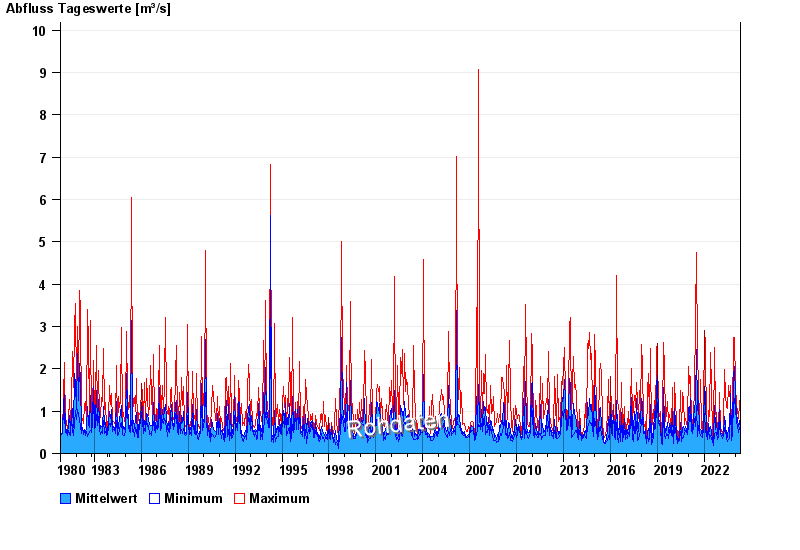
- Chart of total period

Chart of total period Pöttmes / Donaumoos Ach
Discharge from 01.11.1980 to 26.04.2024
| Date | Mean value [m³/s] | Maximum [m³/s] | Minimum [m³/s] |
|---|---|---|---|
| 26.04.2024 | 0.422 | 0.422 | 0.422 |
| 25.04.2024 | 0.439 | 0.448 | 0.422 |
| 24.04.2024 | 0.456 | 0.503 | 0.422 |
| 23.04.2024 | 0.49 | 0.561 | 0.448 |
| 22.04.2024 | 0.546 | 0.592 | 0.476 |
| 21.04.2024 | 0.541 | 0.592 | 0.503 |
| 20.04.2024 | 0.607 | 0.688 | 0.561 |
© Bayerisches Landesamt für Umwelt 2024