
- Start >
- Rivers >
- Discharge >
- Obere Donau >
- Pfaffenhofen >
- Chart of year

Chart of year Pfaffenhofen / Zusam
Discharge from 01.01.2021 to 31.12.2021
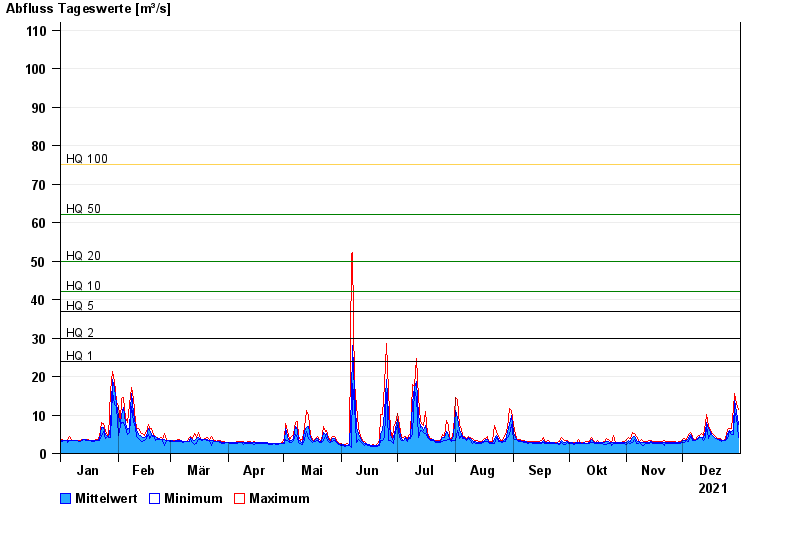
- HQ1 24 m³/s
- HQ2 30 m³/s
- HQ5 37 m³/s
- HQ10 42 m³/s
- HQ20 50 m³/s
- HQ50 62 m³/s
- HQ100 75 m³/s
| Date | Mean value [m³/s] | Maximum [m³/s] | Minimum [m³/s] |
|---|---|---|---|
| 31.12.2021 | 7.45 | 11.4 | 4.06 |
| 30.12.2021 | 10.6 | 13.1 | 9.29 |
| 29.12.2021 | 13.7 | 15.6 | 10.8 |
| 28.12.2021 | 5.88 | 11.8 | 4.92 |
| 27.12.2021 | 5.81 | 6.45 | 5.03 |
| 26.12.2021 | 6.08 | 6.45 | 5.8 |
| 25.12.2021 | 5.28 | 6.12 | 3.92 |
© Bayerisches Landesamt für Umwelt 2024