
- Start >
- Rivers >
- Discharge >
- Obere Donau >
- Pfaffenhofen >
- Chart of year

Chart of year Pfaffenhofen / Zusam
Discharge from 01.01.2019 to 31.12.2019
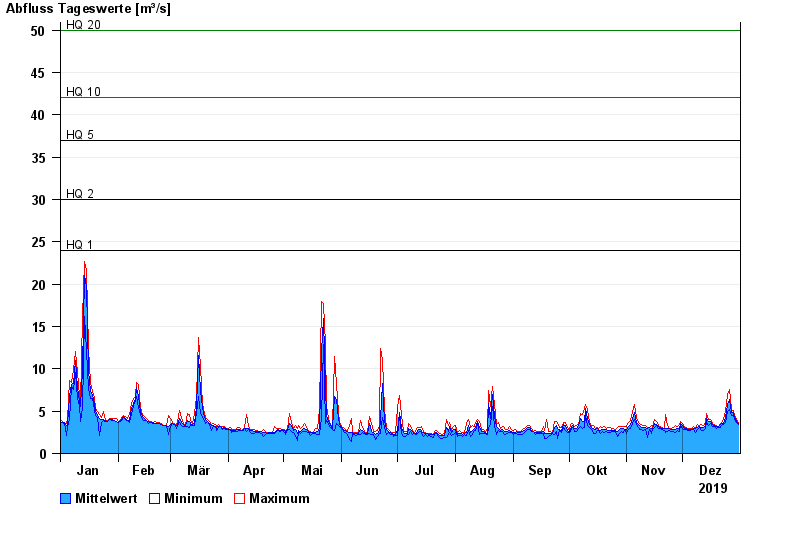
- HQ1 24 m³/s
- HQ2 30 m³/s
- HQ5 37 m³/s
- HQ10 42 m³/s
- HQ20 50 m³/s
- HQ50 62 m³/s
- HQ100 75 m³/s
| Date | Mean value [m³/s] | Maximum [m³/s] | Minimum [m³/s] |
|---|---|---|---|
| 31.12.2019 | 3.52 | 3.62 | 3.39 |
| 30.12.2019 | 3.75 | 3.98 | 3.62 |
| 29.12.2019 | 4.22 | 4.5 | 3.98 |
| 28.12.2019 | 4.87 | 5.07 | 4.5 |
| 27.12.2019 | 4.9 | 5.22 | 4.5 |
| 26.12.2019 | 6.35 | 7.53 | 5.21 |
| 25.12.2019 | 5.74 | 7 | 4.91 |
© Bayerisches Landesamt für Umwelt 2024