
- Start >
- Rivers >
- Discharge >
- Obere Donau >
- Pfaffenhofen >
- Chart of year

Chart of year Pfaffenhofen / Zusam
Discharge from 01.01.2024 to 24.04.2024
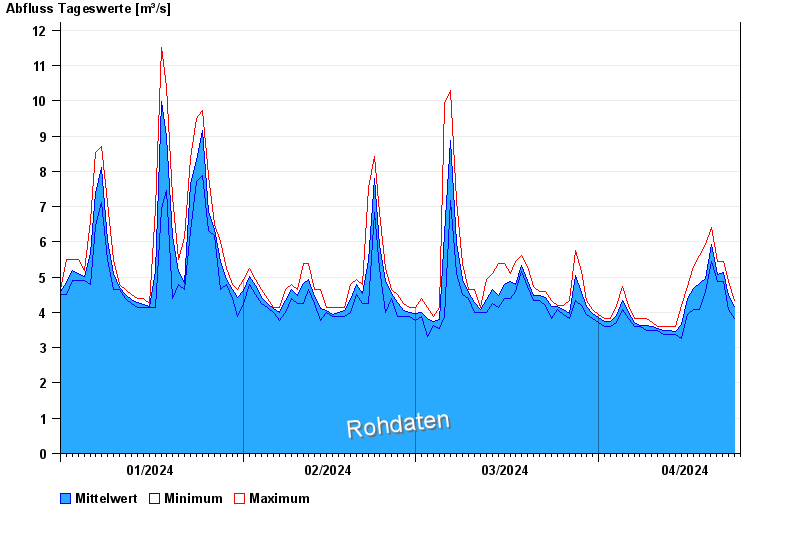
| Date | Mean value [m³/s] | Maximum [m³/s] | Minimum [m³/s] |
|---|---|---|---|
| 24.04.2024 | 4.18 | 4.33 | 3.83 |
| 23.04.2024 | 4.49 | 4.87 | 4.08 |
| 22.04.2024 | 5.13 | 5.45 | 4.87 |
| 21.04.2024 | 5.08 | 5.45 | 4.87 |
| 20.04.2024 | 5.93 | 6.4 | 5.45 |
| 19.04.2024 | 4.96 | 5.92 | 4.6 |
| 18.04.2024 | 4.82 | 5.61 | 4.08 |
© Bayerisches Landesamt für Umwelt 2024