
- Start >
- Rivers >
- Discharge >
- Obere Donau >
- Pfaffenhofen >
- Chart of total period

Chart of total period Pfaffenhofen / Zusam
Discharge from 01.11.1931 to 23.04.2024
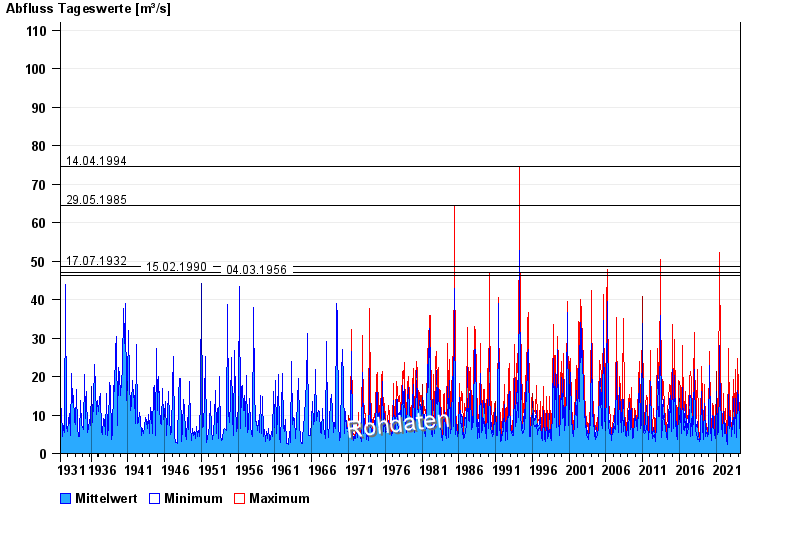
- 14.04.1994 Abfluss: 74,6 m³/s
- 29.05.1985 Abfluss: 64,5 m³/s
- 17.07.1932 Abfluss: 48,6 m³/s
- 15.02.1990 Abfluss: 47,1 m³/s
- 04.03.1956 Abfluss: 46,2 m³/s
| Date | Mean value [m³/s] | Maximum [m³/s] | Minimum [m³/s] |
|---|---|---|---|
| 23.04.2024 | 4.54 | 4.87 | 4.08 |
| 22.04.2024 | 5.13 | 5.45 | 4.87 |
| 21.04.2024 | 5.08 | 5.45 | 4.87 |
| 20.04.2024 | 5.93 | 6.4 | 5.45 |
| 19.04.2024 | 4.96 | 5.92 | 4.6 |
| 18.04.2024 | 4.82 | 5.61 | 4.08 |
| 17.04.2024 | 4.67 | 5.3 | 4.08 |
© Bayerisches Landesamt für Umwelt 2024