
- Start >
- Rivers >
- Discharge >
- Obere Donau >
- Parsberg >
- Chart of year

Chart of year Parsberg / Schwarze Laber
Discharge from 18.11.2018 to 17.11.2019
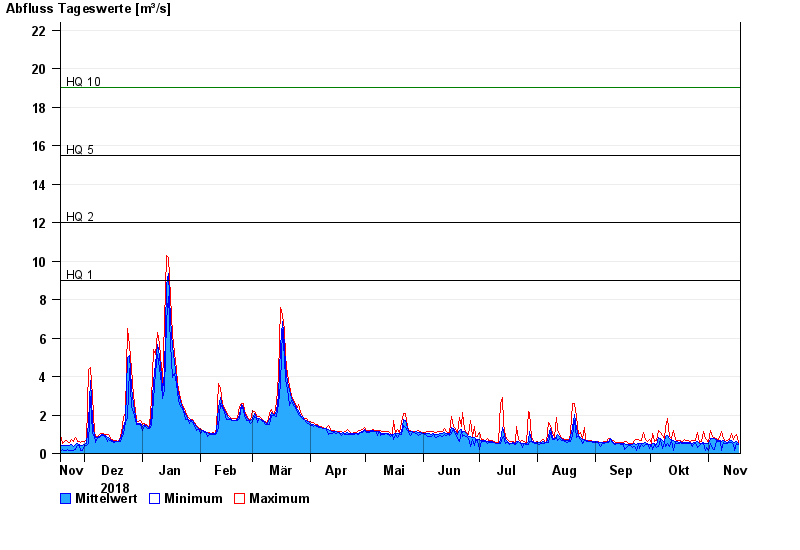
- HQ1 9 m³/s
- HQ2 12 m³/s
- HQ5 15,5 m³/s
- HQ10 19 m³/s
- HQ20 25 m³/s
- HQ50 36 m³/s
- HQ100 50 m³/s
| Date | Mean value [m³/s] | Maximum [m³/s] | Minimum [m³/s] |
|---|---|---|---|
| 17.11.2019 | 0.542 | 0.589 | 0.462 |
| 16.11.2019 | 0.605 | 0.963 | 0.501 |
| 15.11.2019 | 0.563 | 0.907 | 0.147 |
| 14.11.2019 | 0.579 | 0.743 | 0.462 |
| 13.11.2019 | 0.683 | 1.02 | 0.589 |
| 12.11.2019 | 0.66 | 0.743 | 0.589 |
| 11.11.2019 | 0.591 | 0.69 | 0.544 |
© Bayerisches Landesamt für Umwelt 2024