
- Start >
- Rivers >
- Discharge >
- Obere Donau >
- Parsberg >
- Chart of year

Chart of year Parsberg / Schwarze Laber
Discharge from 18.11.2017 to 17.11.2018
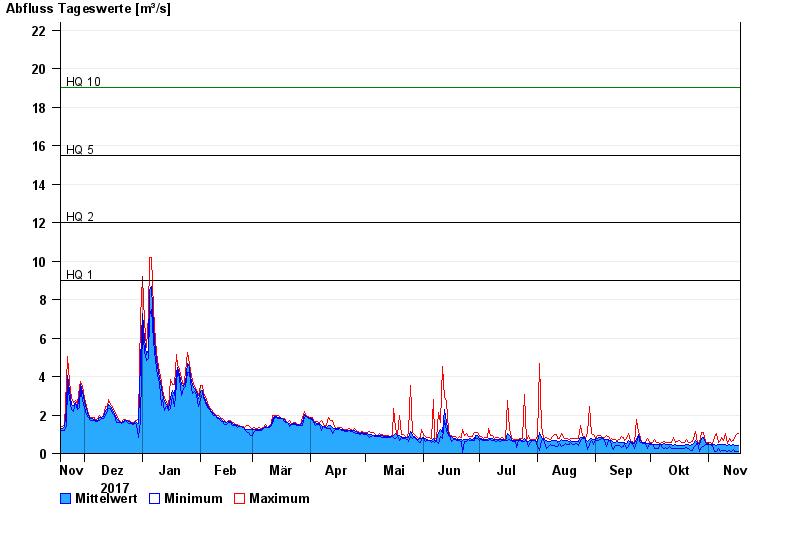
- HQ1 9 m³/s
- HQ2 12 m³/s
- HQ5 15,5 m³/s
- HQ10 19 m³/s
- HQ20 25 m³/s
- HQ50 36 m³/s
- HQ100 50 m³/s
| Date | Mean value [m³/s] | Maximum [m³/s] | Minimum [m³/s] |
|---|---|---|---|
| 17.11.2018 | 0.398 | 1.04 | 0.112 |
| 16.11.2018 | 0.427 | 0.984 | 0.112 |
| 15.11.2018 | 0.434 | 0.829 | 0.125 |
| 14.11.2018 | 0.451 | 0.683 | 0.23 |
| 13.11.2018 | 0.394 | 0.637 | 0.125 |
| 12.11.2018 | 0.459 | 0.779 | 0.139 |
| 11.11.2018 | 0.413 | 0.503 | 0.112 |
© Bayerisches Landesamt für Umwelt 2024