
- Start >
- Rivers >
- Discharge >
- Obere Donau >
- Parsberg >
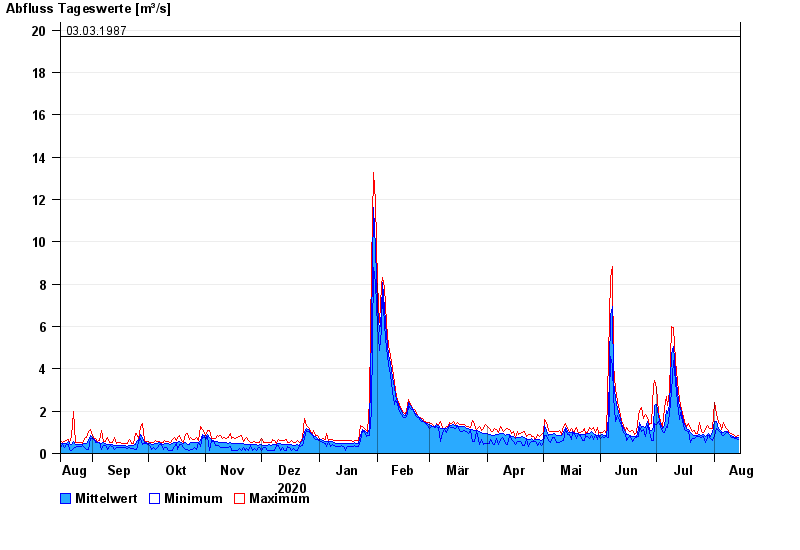
- Chart of year

Chart of year Parsberg / Schwarze Laber
Discharge from 15.08.2020 to 14.08.2021
- 14.01.2011 Abfluss: 30,4 m³/s
- 23.02.1970 Abfluss: 27,3 m³/s
- 13.02.2005 Abfluss: 20,5 m³/s
- 21.12.1993 Abfluss: 20,3 m³/s
- 03.03.1987 Abfluss: 19,7 m³/s
| Date | Mean value [m³/s] | Maximum [m³/s] | Minimum [m³/s] |
|---|---|---|---|
| 14.08.2021 | 0.737 | 0.849 | 0.656 |
| 13.08.2021 | 0.751 | 0.791 | 0.695 |
| 12.08.2021 | 0.76 | 0.838 | 0.691 |
| 11.08.2021 | 0.811 | 0.888 | 0.777 |
| 10.08.2021 | 0.843 | 0.94 | 0.776 |
| 09.08.2021 | 0.92 | 0.997 | 0.876 |
| 08.08.2021 | 1.02 | 1.14 | 0.991 |
© Bayerisches Landesamt für Umwelt 2024