
- Start >
- Rivers >
- Discharge >
- Obere Donau >
- Parsberg >
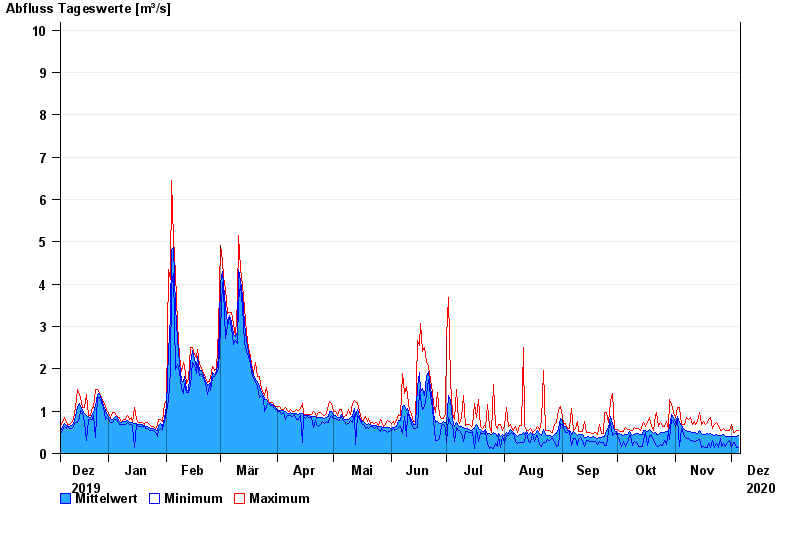
- Chart of year

Chart of year Parsberg / Schwarze Laber
Discharge from 06.12.2019 to 05.12.2020
- 14.01.2011 Abfluss: 30,4 m³/s
- 23.02.1970 Abfluss: 27,3 m³/s
- 13.02.2005 Abfluss: 20,5 m³/s
- 21.12.1993 Abfluss: 20,3 m³/s
- 03.03.1987 Abfluss: 19,7 m³/s
| Date | Mean value [m³/s] | Maximum [m³/s] | Minimum [m³/s] |
|---|---|---|---|
| 05.12.2020 | 0.417 | 0.54 | 0.146 |
| 04.12.2020 | 0.398 | 0.54 | 0.146 |
| 03.12.2020 | 0.401 | 0.499 | 0.269 |
| 02.12.2020 | 0.395 | 0.499 | 0.269 |
| 01.12.2020 | 0.403 | 0.687 | 0.131 |
| 30.11.2020 | 0.411 | 0.542 | 0.296 |
| 29.11.2020 | 0.4 | 0.542 | 0.27 |
© Bayerisches Landesamt für Umwelt 2024