
- Start >
- Rivers >
- Discharge >
- Obere Donau >
- Parsberg >
- Chart of year

Chart of year Parsberg / Schwarze Laber
Discharge from 29.03.2019 to 28.03.2020
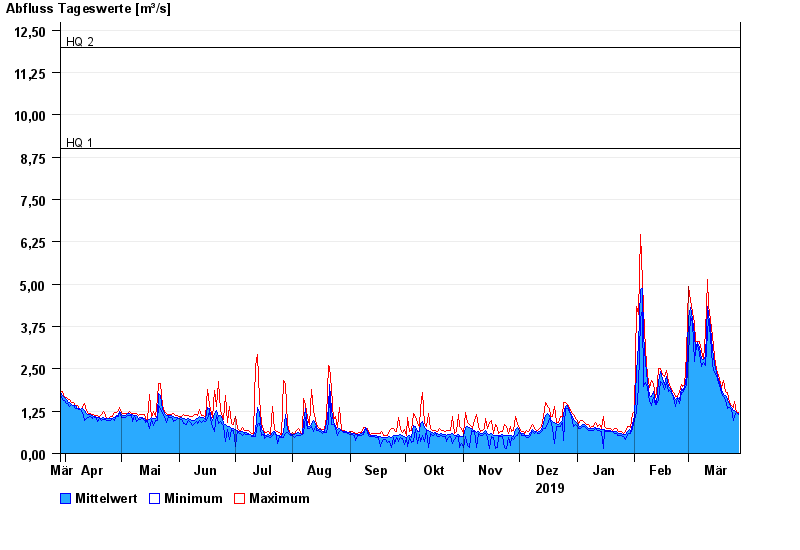
- HQ1 9 m³/s
- HQ2 12 m³/s
- HQ5 15,5 m³/s
- HQ10 19 m³/s
- HQ20 25 m³/s
- HQ50 36 m³/s
- HQ100 50 m³/s
| Date | Mean value [m³/s] | Maximum [m³/s] | Minimum [m³/s] |
|---|---|---|---|
| 28.03.2020 | 1.19 | 1.21 | 1.14 |
| 27.03.2020 | 1.21 | 1.21 | 1.21 |
| 26.03.2020 | 1.28 | 1.55 | 1.1 |
| 25.03.2020 | 1.28 | 1.36 | 0.984 |
| 24.03.2020 | 1.36 | 1.43 | 1.29 |
| 23.03.2020 | 1.44 | 1.51 | 1.37 |
| 22.03.2020 | 1.58 | 1.81 | 1.32 |
© Bayerisches Landesamt für Umwelt 2024