
- Start >
- Rivers >
- Discharge >
- Obere Donau >
- Parsberg >
- Chart of year

Chart of year Parsberg / Schwarze Laber
Discharge from 25.07.2021 to 24.07.2022
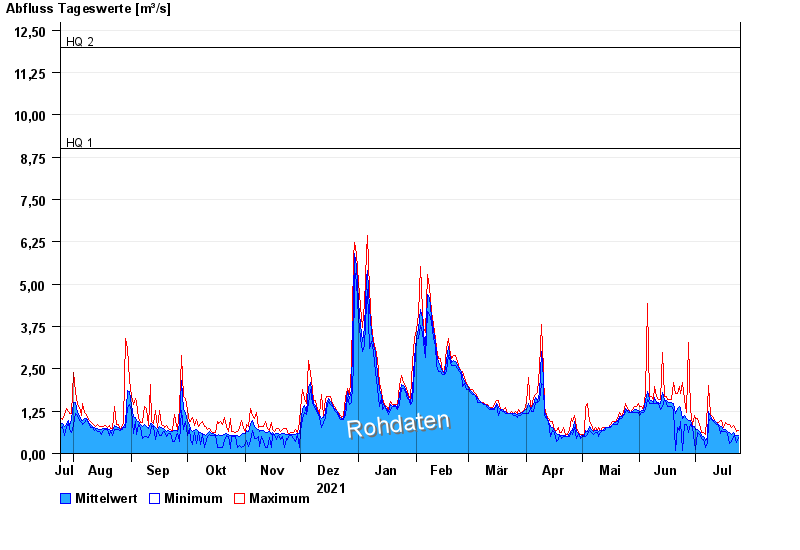
- HQ1 9 m³/s
- HQ2 12 m³/s
- HQ5 15,5 m³/s
- HQ10 19 m³/s
- HQ20 25 m³/s
- HQ50 36 m³/s
- HQ100 50 m³/s
| Date | Mean value [m³/s] | Maximum [m³/s] | Minimum [m³/s] |
|---|---|---|---|
| 24.07.2022 | 0.527 | 0.683 | 0.464 |
| 23.07.2022 | 0.539 | 0.645 | 0.315 |
| 22.07.2022 | 0.571 | 0.77 | 0.531 |
| 21.07.2022 | 0.61 | 0.817 | 0.499 |
| 20.07.2022 | 0.575 | 0.77 | 0.34 |
| 19.07.2022 | 0.612 | 0.866 | 0.289 |
| 18.07.2022 | 0.65 | 0.866 | 0.605 |
© Bayerisches Landesamt für Umwelt 2024