
- Start >
- Rivers >
- Discharge >
- Obere Donau >
- Parsberg >
- Chart of year

Chart of year Parsberg / Schwarze Laber
Discharge from 17.02.2019 to 16.02.2020
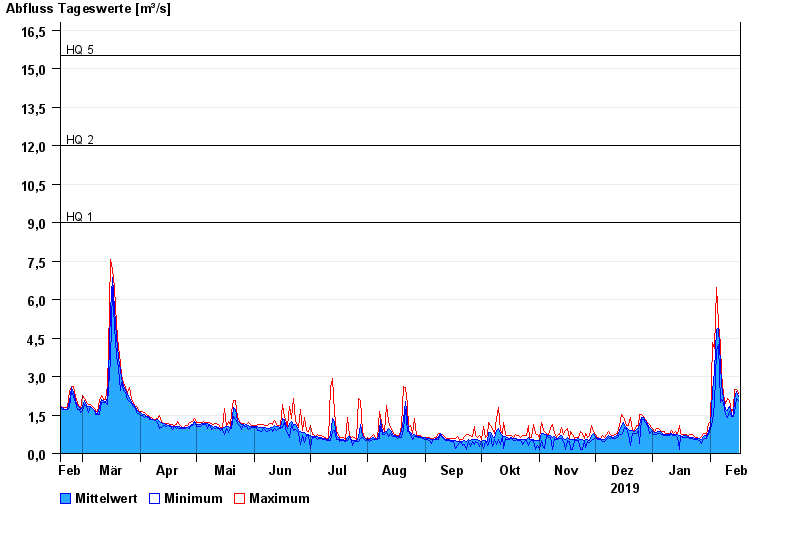
- HQ1 9 m³/s
- HQ2 12 m³/s
- HQ5 15,5 m³/s
- HQ10 19 m³/s
- HQ20 25 m³/s
- HQ50 36 m³/s
- HQ100 50 m³/s
| Date | Mean value [m³/s] | Maximum [m³/s] | Minimum [m³/s] |
|---|---|---|---|
| 16.02.2020 | 2.21 | 2.34 | 2.07 |
| 15.02.2020 | 2.43 | 2.51 | 2.14 |
| 14.02.2020 | 2.12 | 2.5 | 1.6 |
| 13.02.2020 | 1.48 | 1.76 | 1.44 |
| 12.02.2020 | 1.51 | 1.65 | 1.44 |
| 11.02.2020 | 1.83 | 2.07 | 1.65 |
| 10.02.2020 | 1.69 | 2.15 | 1.41 |
© Bayerisches Landesamt für Umwelt 2024