
- Start >
- Rivers >
- Discharge >
- Obere Donau >
- Parsberg >
- Chart of year

Chart of year Parsberg / Schwarze Laber
Discharge from 06.08.2019 to 05.08.2020
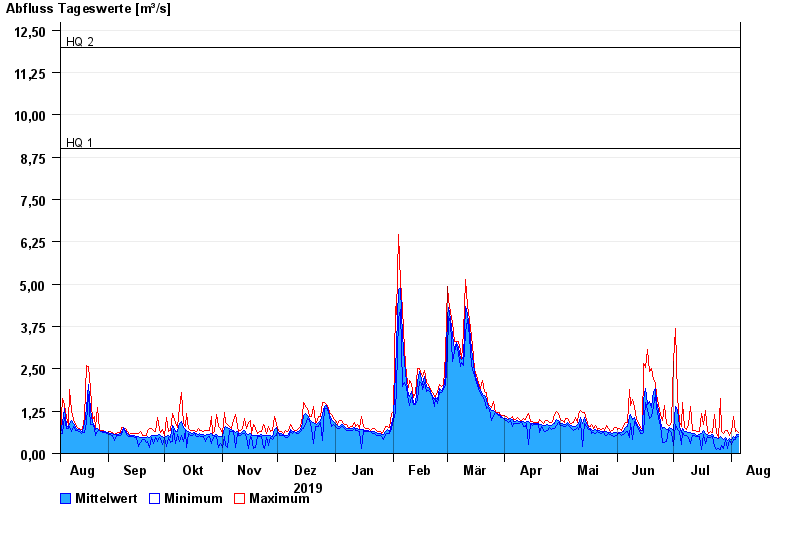
- HQ1 9 m³/s
- HQ2 12 m³/s
- HQ5 15,5 m³/s
- HQ10 19 m³/s
- HQ20 25 m³/s
- HQ50 36 m³/s
- HQ100 50 m³/s
| Date | Mean value [m³/s] | Maximum [m³/s] | Minimum [m³/s] |
|---|---|---|---|
| 05.08.2020 | 0.55 | 0.612 | 0.505 |
| 04.08.2020 | 0.566 | 0.692 | 0.461 |
| 03.08.2020 | 0.474 | 0.636 | 0.419 |
| 02.08.2020 | 0.488 | 1.08 | 0.414 |
| 01.08.2020 | 0.427 | 0.657 | 0.259 |
| 31.07.2020 | 0.446 | 0.533 | 0.398 |
| 30.07.2020 | 0.39 | 0.686 | 0.133 |
© Bayerisches Landesamt für Umwelt 2024