
- Start >
- Rivers >
- Discharge >
- Obere Donau >
- Parsberg >
- Chart of year

Chart of year Parsberg / Schwarze Laber
Discharge from 06.08.2017 to 05.08.2018
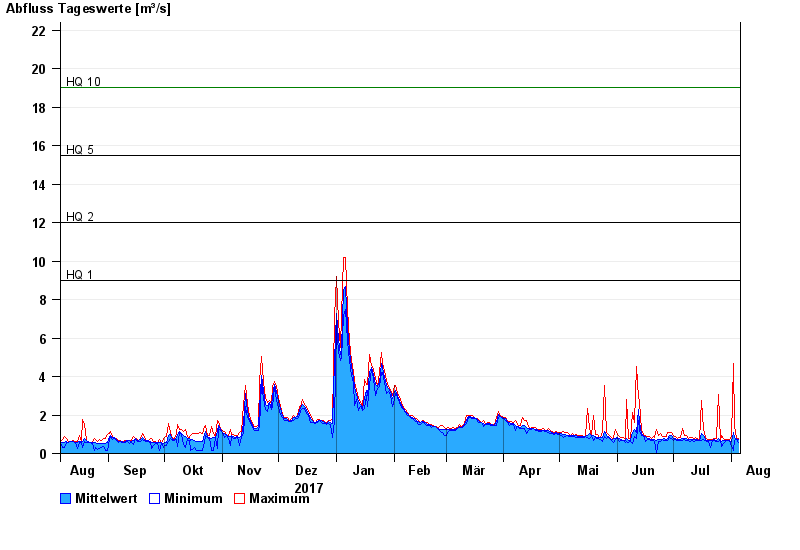
- HQ1 9 m³/s
- HQ2 12 m³/s
- HQ5 15,5 m³/s
- HQ10 19 m³/s
- HQ20 25 m³/s
- HQ50 36 m³/s
- HQ100 50 m³/s
| Date | Mean value [m³/s] | Maximum [m³/s] | Minimum [m³/s] |
|---|---|---|---|
| 05.08.2018 | 0.713 | 0.803 | 0.555 |
| 04.08.2018 | 0.754 | 0.794 | 0.704 |
| 03.08.2018 | 0.84 | 1.46 | 0.692 |
| 02.08.2018 | 1.1 | 4.69 | 0.161 |
| 01.08.2018 | 0.642 | 0.863 | 0.34 |
| 31.07.2018 | 0.667 | 0.712 | 0.66 |
| 30.07.2018 | 0.667 | 0.739 | 0.652 |
© Bayerisches Landesamt für Umwelt 2024