
- Start >
- Rivers >
- Discharge >
- Obere Donau >
- Parsberg >
- Chart of year

Chart of year Parsberg / Schwarze Laber
Discharge from 06.08.2016 to 05.08.2017
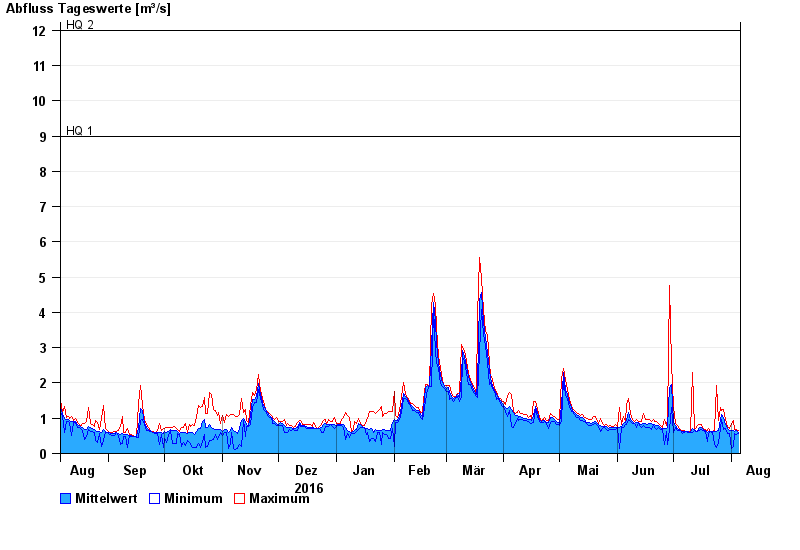
- HQ1 9 m³/s
- HQ2 12 m³/s
- HQ5 15,5 m³/s
- HQ10 19 m³/s
- HQ20 25 m³/s
- HQ50 36 m³/s
- HQ100 50 m³/s
| Date | Mean value [m³/s] | Maximum [m³/s] | Minimum [m³/s] |
|---|---|---|---|
| 05.08.2017 | 0.603 | 0.641 | 0.57 |
| 04.08.2017 | 0.643 | 0.68 | 0.529 |
| 03.08.2017 | 0.636 | 0.675 | 0.555 |
| 02.08.2017 | 0.656 | 0.949 | 0.197 |
| 01.08.2017 | 0.638 | 0.837 | 0.149 |
| 31.07.2017 | 0.647 | 0.696 | 0.577 |
| 30.07.2017 | 0.701 | 0.777 | 0.571 |
© Bayerisches Landesamt für Umwelt 2024