
- Start >
- Rivers >
- Discharge >
- Obere Donau >
- Oberndorf >
- Chart of year

Chart of year Oberndorf / Donau
Discharge from 01.01.2019 to 31.12.2019
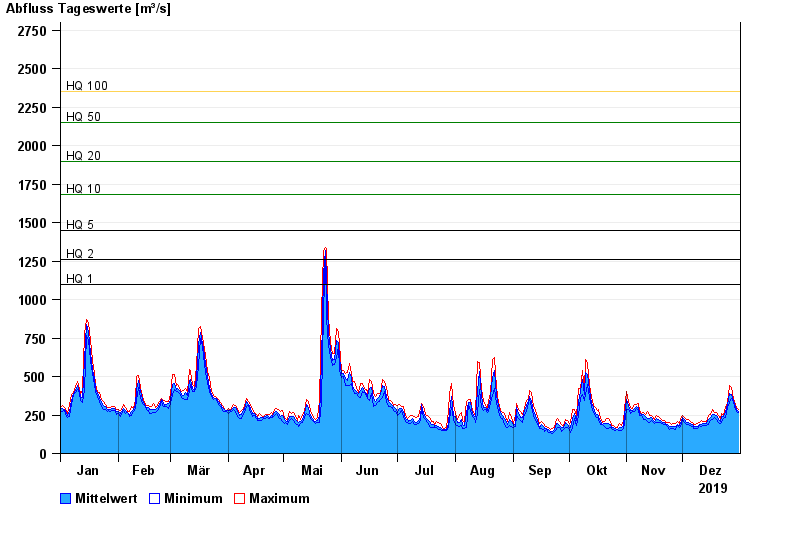
- HQ1 1100 m³/s
- HQ2 1260 m³/s
- HQ5 1450 m³/s
- HQ10 1680 m³/s
- HQ20 1900 m³/s
- HQ50 2150 m³/s
- HQ100 2350 m³/s
| Date | Mean value [m³/s] | Maximum [m³/s] | Minimum [m³/s] |
|---|---|---|---|
| 31.12.2019 | 272 | 286 | 265 |
| 30.12.2019 | 288 | 301 | 271 |
| 29.12.2019 | 322 | 337 | 298 |
| 28.12.2019 | 344 | 355 | 337 |
| 27.12.2019 | 385 | 428 | 355 |
| 26.12.2019 | 391 | 440 | 331 |
| 25.12.2019 | 316 | 331 | 301 |
© Bayerisches Landesamt für Umwelt 2024