
- Start >
- Rivers >
- Discharge >
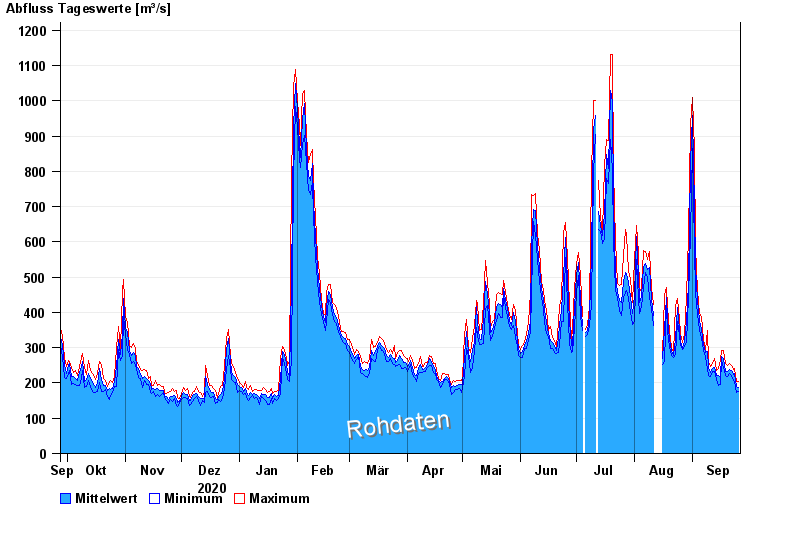
- Obere Donau >
- Oberndorf >
- Chart of year

Chart of year Oberndorf / Donau
Discharge from 27.09.2020 to 26.09.2021
| Date | Mean value [m³/s] | Maximum [m³/s] | Minimum [m³/s] |
|---|---|---|---|
| 26.09.2021 | 188 | 203 | 176 |
| 25.09.2021 | 189 | 203 | 174 |
| 24.09.2021 | 226 | 241 | 203 |
| 23.09.2021 | 223 | 238 | 206 |
| 22.09.2021 | 234 | 250 | 221 |
| 21.09.2021 | 239 | 256 | 226 |
| 20.09.2021 | 232 | 250 | 218 |
© Bayerisches Landesamt für Umwelt 2024