
- Start >
- Rivers >
- Discharge >
- Obere Donau >
- Oberndorf >
- Chart of year

Chart of year Oberndorf / Donau
Discharge from 01.01.2024 to 19.04.2024
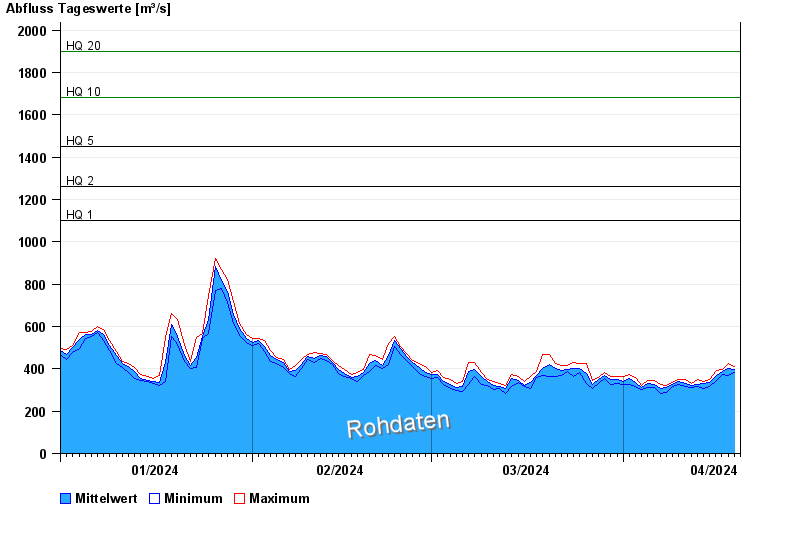
- HQ1 1100 m³/s
- HQ2 1260 m³/s
- HQ5 1450 m³/s
- HQ10 1680 m³/s
- HQ20 1900 m³/s
- HQ50 2150 m³/s
- HQ100 2350 m³/s
| Date | Mean value [m³/s] | Maximum [m³/s] | Minimum [m³/s] |
|---|---|---|---|
| 19.04.2024 | 410 | 412 | 405 |
| 18.04.2024 | 400 | 424 | 369 |
| 17.04.2024 | 388 | 396 | 375 |
| 16.04.2024 | 370 | 393 | 345 |
| 15.04.2024 | 337 | 351 | 318 |
| 14.04.2024 | 331 | 342 | 309 |
| 13.04.2024 | 328 | 348 | 315 |
© Bayerisches Landesamt für Umwelt 2024