
- Start >
- Rivers >
- Discharge >
- Obere Donau >
- Obermenzing >
- Chart of year

Chart of year Obermenzing / Würm
Discharge from 01.01.2024 to 17.04.2024
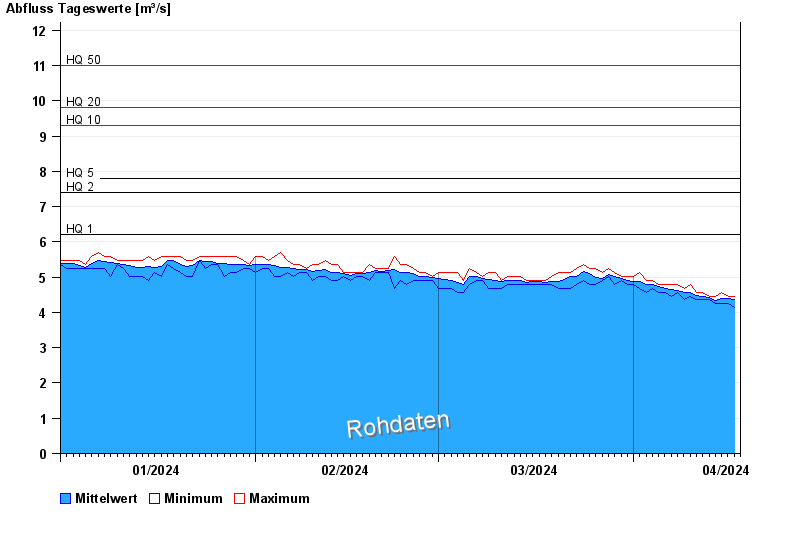
- HQ1 6,2 m³/s
- HQ2 7,4 m³/s
- HQ5 7,8 m³/s
- HQ10 9,3 m³/s
- HQ20 9,8 m³/s
- HQ50 11 m³/s
- HQ100 12,5 m³/s
| Date | Mean value [m³/s] | Maximum [m³/s] | Minimum [m³/s] |
|---|---|---|---|
| 17.04.2024 | 4.36 | 4.46 | 4.25 |
| 16.04.2024 | 4.38 | 4.46 | 4.25 |
| 15.04.2024 | 4.38 | 4.57 | 4.25 |
| 14.04.2024 | 4.35 | 4.46 | 4.25 |
| 13.04.2024 | 4.42 | 4.46 | 4.36 |
| 12.04.2024 | 4.45 | 4.57 | 4.36 |
| 11.04.2024 | 4.49 | 4.57 | 4.36 |
© Bayerisches Landesamt für Umwelt 2024