
- Start >
- Rivers >
- Discharge >
- Obere Donau >
- Oberding >
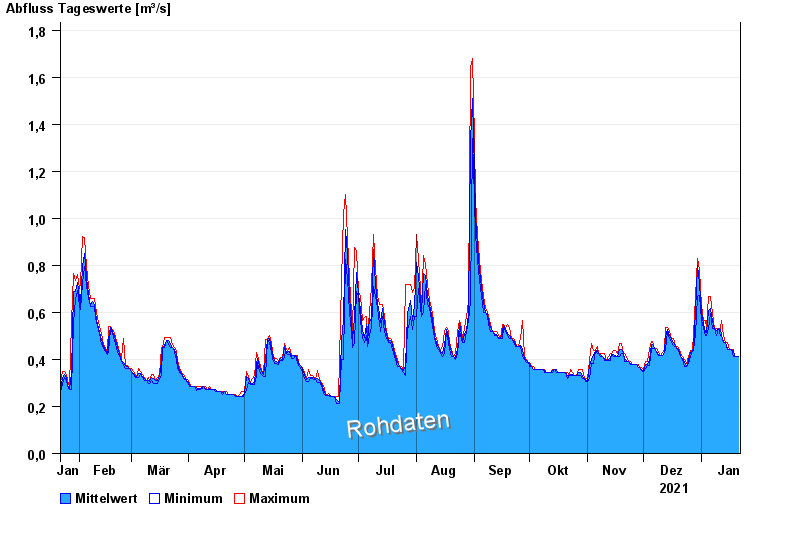
- Chart of year

Chart of year Oberding / Gfällach
Discharge from 22.01.2021 to 21.01.2022
| Date | Mean value [m³/s] | Maximum [m³/s] | Minimum [m³/s] |
|---|---|---|---|
| 21.01.2022 | 0.413 | 0.413 | 0.413 |
| 20.01.2022 | 0.413 | 0.413 | 0.413 |
| 19.01.2022 | 0.413 | 0.413 | 0.413 |
| 18.01.2022 | 0.44 | 0.441 | 0.413 |
| 17.01.2022 | 0.441 | 0.441 | 0.441 |
| 16.01.2022 | 0.441 | 0.441 | 0.441 |
| 15.01.2022 | 0.448 | 0.471 | 0.441 |
© Bayerisches Landesamt für Umwelt 2024