
- Start >
- Rivers >
- Discharge >
- Obere Donau >
- Oberding >
- Chart of year

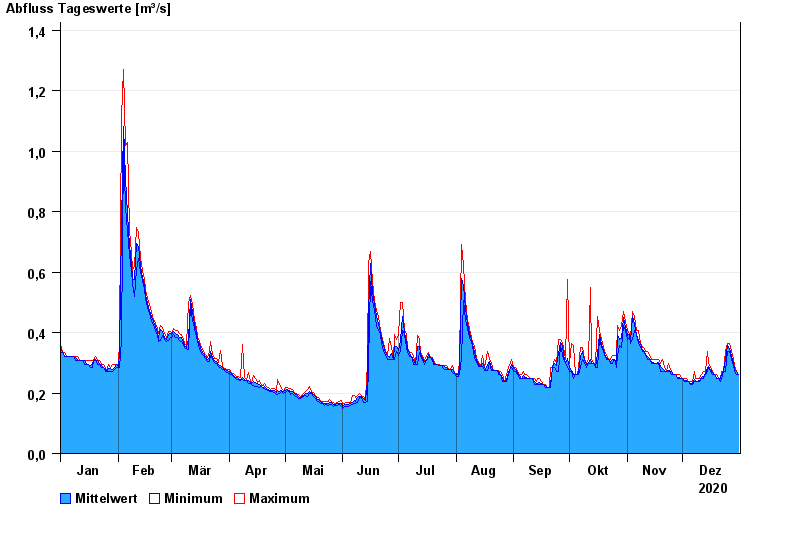
Chart of year Oberding / Gfällach
Discharge from 01.01.2020 to 31.12.2020
| Date | Mean value [m³/s] | Maximum [m³/s] | Minimum [m³/s] |
|---|---|---|---|
| 31.12.2020 | 0.261 | 0.261 | 0.261 |
| 30.12.2020 | 0.272 | 0.272 | 0.261 |
| 29.12.2020 | 0.278 | 0.292 | 0.272 |
| 28.12.2020 | 0.3 | 0.31 | 0.292 |
| 27.12.2020 | 0.32 | 0.336 | 0.31 |
| 26.12.2020 | 0.348 | 0.364 | 0.336 |
| 25.12.2020 | 0.357 | 0.364 | 0.336 |
© Bayerisches Landesamt für Umwelt 2024