
- Start >
- Rivers >
- Discharge >
- Obere Donau >
- Oberding >
- Chart of year

Chart of year Oberding / Gfällach
Discharge from 01.01.2024 to 25.04.2024
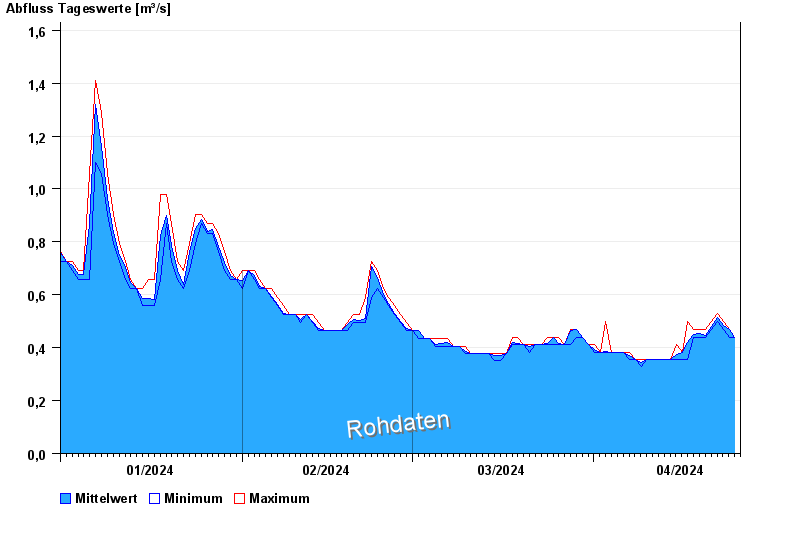
| Date | Mean value [m³/s] | Maximum [m³/s] | Minimum [m³/s] |
|---|---|---|---|
| 25.04.2024 | 0.439 | 0.439 | 0.439 |
| 24.04.2024 | 0.467 | 0.469 | 0.439 |
| 23.04.2024 | 0.484 | 0.5 | 0.469 |
| 22.04.2024 | 0.513 | 0.531 | 0.5 |
| 21.04.2024 | 0.48 | 0.5 | 0.469 |
| 20.04.2024 | 0.446 | 0.469 | 0.439 |
| 19.04.2024 | 0.453 | 0.469 | 0.439 |
© Bayerisches Landesamt für Umwelt 2024