
- Start >
- Rivers >
- Discharge >
- Obere Donau >
- Oberding >
- Chart of year

Chart of year Oberding / Gfällach
Discharge from 29.05.2019 to 28.05.2020
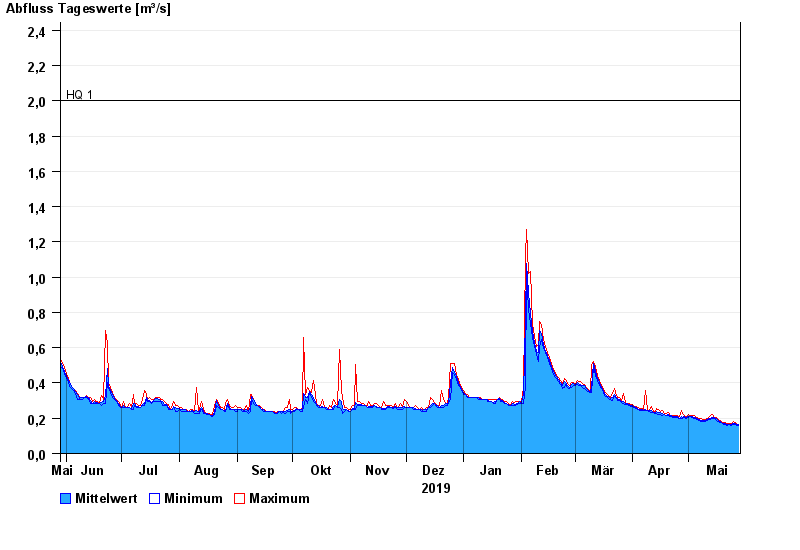
- HQ1 2 m³/s
- HQ2 2,5 m³/s
- HQ5 2,9 m³/s
- HQ10 3,4 m³/s
- HQ20 3,8 m³/s
- HQ50 4,4 m³/s
- HQ100 4,9 m³/s
| Date | Mean value [m³/s] | Maximum [m³/s] | Minimum [m³/s] |
|---|---|---|---|
| 28.05.2020 | 0.162 | 0.167 | 0.158 |
| 27.05.2020 | 0.163 | 0.169 | 0.156 |
| 26.05.2020 | 0.168 | 0.173 | 0.162 |
| 25.05.2020 | 0.169 | 0.18 | 0.163 |
| 24.05.2020 | 0.166 | 0.172 | 0.16 |
| 23.05.2020 | 0.166 | 0.172 | 0.162 |
| 22.05.2020 | 0.165 | 0.171 | 0.159 |
© Bayerisches Landesamt für Umwelt 2024