
- Start >
- Rivers >
- Discharge >
- Obere Donau >
- Neustadt >
- Chart of total period

Chart of total period Neustadt / Donau
Discharge from 01.01.2010 to 19.04.2024
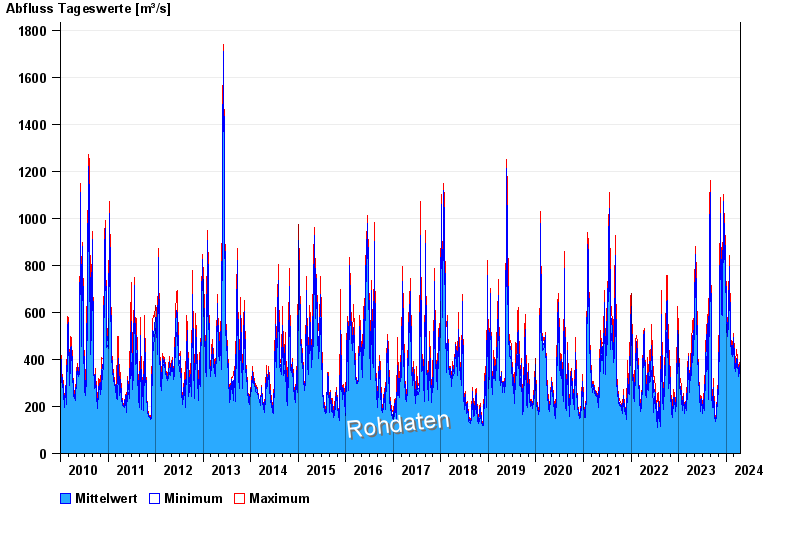
| Date | Mean value [m³/s] | Maximum [m³/s] | Minimum [m³/s] |
|---|---|---|---|
| 19.04.2024 | 386 | 386 | 386 |
| 18.04.2024 | 387 | 405 | 350 |
| 17.04.2024 | 366 | 377 | 350 |
| 16.04.2024 | 363 | 375 | 347 |
| 15.04.2024 | 327 | 347 | 315 |
| 14.04.2024 | 320 | 328 | 310 |
| 13.04.2024 | 315 | 320 | 307 |
© Bayerisches Landesamt für Umwelt 2024