
- Start >
- Rivers >
- Discharge >
- Obere Donau >
- Neu Ulm, Bad Held >
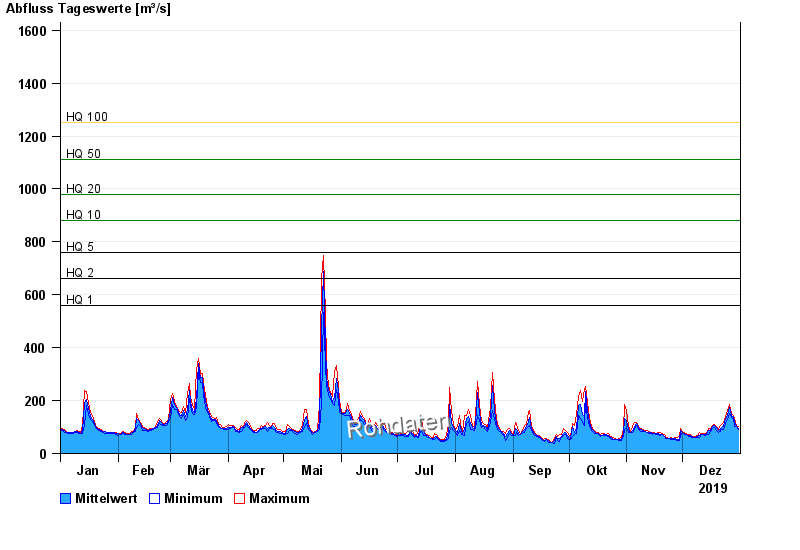
- Chart of year

Chart of year Neu Ulm, Bad Held / Donau
Discharge from 01.01.2019 to 31.12.2019
ACHTUNG!
Pegel durch außerordentlichen Kraftwerksbetrieb beeinflusst.
- HQ1 560 m³/s
- HQ2 660 m³/s
- HQ5 760 m³/s
- HQ10 880 m³/s
- HQ20 980 m³/s
- HQ50 1110 m³/s
- HQ100 1250 m³/s
| Date | Mean value [m³/s] | Maximum [m³/s] | Minimum [m³/s] |
|---|---|---|---|
| 31.12.2019 | 95.9 | 102 | 90.4 |
| 30.12.2019 | 103 | 106 | 101 |
| 29.12.2019 | 117 | 133 | 102 |
| 28.12.2019 | 138 | 145 | 131 |
| 27.12.2019 | 142 | 151 | 135 |
| 26.12.2019 | 173 | 187 | 151 |
| 25.12.2019 | 144 | 164 | 129 |
© Bayerisches Landesamt für Umwelt 2024