
- Start >
- Rivers >
- Discharge >
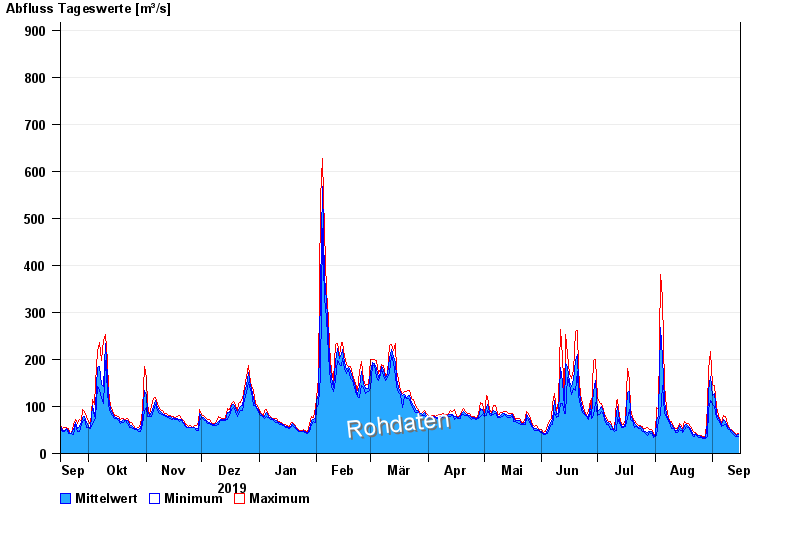
- Obere Donau >
- Neu Ulm, Bad Held >
- Chart of year

Chart of year Neu Ulm, Bad Held / Donau
Discharge from 16.09.2019 to 15.09.2020
ACHTUNG!
Pegel durch außerordentlichen Kraftwerksbetrieb beeinflusst.
- 29.12.1882 Abfluss: 1250 m³/s
- 02.02.1862 Abfluss: 1140 m³/s
- 13.06.1876 Abfluss: 1050 m³/s
- 23.05.1999 Abfluss: 1020 m³/s
- 24.08.2005 Abfluss: 975 m³/s
| Date | Mean value [m³/s] | Maximum [m³/s] | Minimum [m³/s] |
|---|---|---|---|
| 15.09.2020 | 39.8 | 43 | 37.2 |
| 14.09.2020 | 39.3 | 41.1 | 37.2 |
| 13.09.2020 | 40.5 | 43 | 37.2 |
| 12.09.2020 | 44.4 | 46.9 | 41.1 |
| 11.09.2020 | 49.1 | 50.6 | 44.9 |
| 10.09.2020 | 52.2 | 54.1 | 50.6 |
| 09.09.2020 | 57.4 | 62.5 | 53.3 |
© Bayerisches Landesamt für Umwelt 2024