
- Start >
- Rivers >
- Discharge >
- Obere Donau >
- Neu Ulm, Bad Held >
- Chart of year

Chart of year Neu Ulm, Bad Held / Donau
Discharge from 19.02.2020 to 18.02.2021
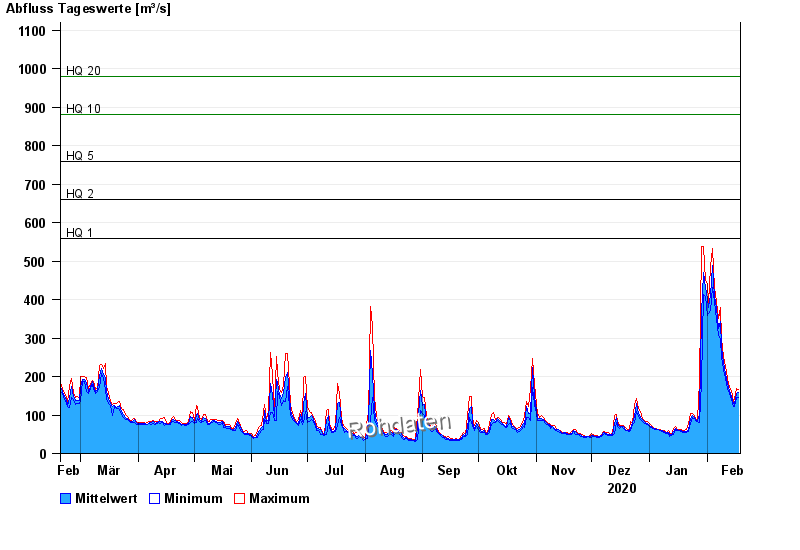
ACHTUNG!
Pegel durch außerordentlichen Kraftwerksbetrieb beeinflusst.
- HQ1 560 m³/s
- HQ2 660 m³/s
- HQ5 760 m³/s
- HQ10 880 m³/s
- HQ20 980 m³/s
- HQ50 1110 m³/s
- HQ100 1250 m³/s
| Date | Mean value [m³/s] | Maximum [m³/s] | Minimum [m³/s] |
|---|---|---|---|
| 18.02.2021 | 158 | 166 | 146 |
| 17.02.2021 | 156 | 168 | 146 |
| 16.02.2021 | 129 | 144 | 123 |
| 15.02.2021 | 130 | 135 | 123 |
| 14.02.2021 | 148 | 165 | 140 |
| 13.02.2021 | 163 | 171 | 157 |
| 12.02.2021 | 183 | 195 | 169 |
© Bayerisches Landesamt für Umwelt 2024