
- Start >
- Rivers >
- Discharge >
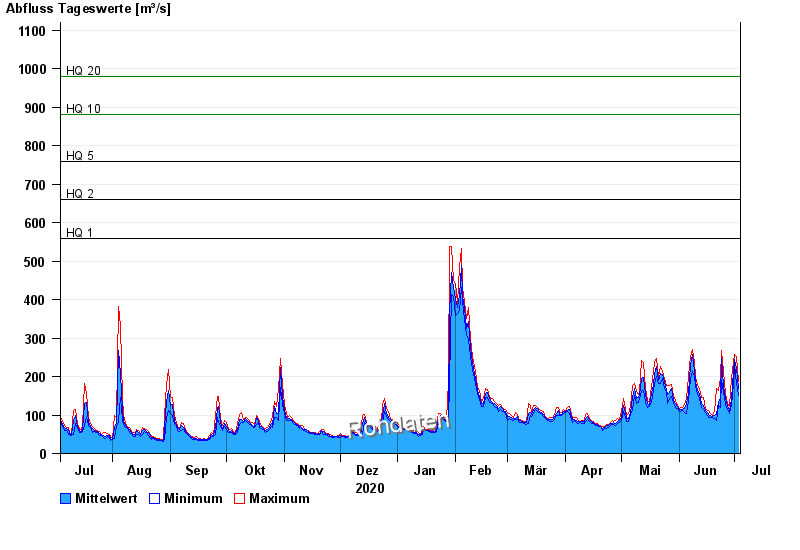
- Obere Donau >
- Neu Ulm, Bad Held >
- Chart of year

Chart of year Neu Ulm, Bad Held / Donau
Discharge from 04.07.2020 to 03.07.2021
ACHTUNG!
Pegel durch außerordentlichen Kraftwerksbetrieb beeinflusst.
- HQ1 560 m³/s
- HQ2 660 m³/s
- HQ5 760 m³/s
- HQ10 880 m³/s
- HQ20 980 m³/s
- HQ50 1110 m³/s
- HQ100 1250 m³/s
| Date | Mean value [m³/s] | Maximum [m³/s] | Minimum [m³/s] |
|---|---|---|---|
| 03.07.2021 | 169 | 188 | 150 |
| 02.07.2021 | 220 | 253 | 183 |
| 01.07.2021 | 243 | 256 | 230 |
| 30.06.2021 | 213 | 239 | 181 |
| 29.06.2021 | 141 | 196 | 124 |
| 28.06.2021 | 113 | 122 | 103 |
| 27.06.2021 | 123 | 129 | 114 |
© Bayerisches Landesamt für Umwelt 2024